

Scanning Imaging Absorption spectrometer for Atmospheric Chartography
(SCIAMACHY) (Liu et al. 2017a, b).
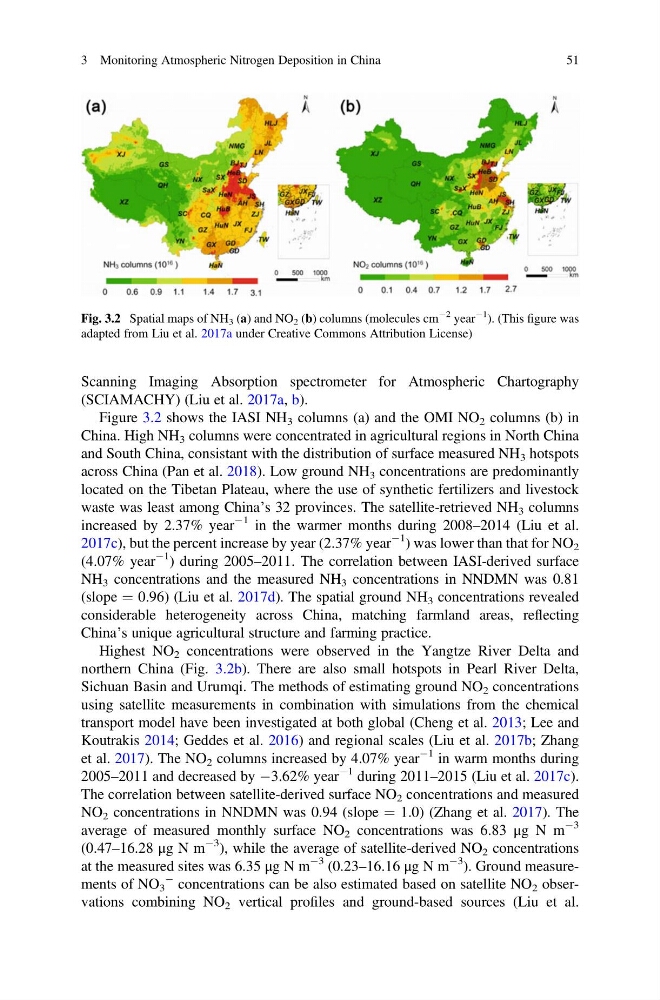
Figure 3.2 shows the IASI NH 3 columns (a) and the OMI NO 2 columns (b) in
China. High NH 3 columns were concentrated in agricultural regions in North China
and South China, consistant with the distribution of surface measured NH 3 hotspots
across China (Pan et al. 2018). Low ground NH 3 concentrations are predominantly
located on the Tibetan Plateau, where the use of synthetic fertilizers and livestock
waste was least among China’s 32 provinces. The satellite-retrieved NH 3 columns
increased by 2.37% year
À1 in the warmer months during 2008–2014 (Liu et al.
2017c), but the percent increase by year (2.37% year
À1 ) was lower than that for NO 2
(4.07% year
À1 ) during 2005–2011. The correlation between IASI-derived surface
NH 3 concentrations and the measured NH 3 concentrations in NNDMN was 0.81
(slope ¼ 0.96) (Liu et al. 2017d). The spatial ground NH 3 concentrations revealed
considerable heterogeneity across China, matching farmland areas, reflecting
China’s unique agricultural structure and farming practice.
Highest NO 2 concentrations were observed in the Yangtze River Delta and
northern China (Fig. 3.2b). There are also small hotspots in Pearl River Delta,
Sichuan Basin and Urumqi. The methods of estimating ground NO 2 concentrations
using satellite measurements in combination with simulations from the chemical
transport model have been investigated at both global (Cheng et al. 2013; Lee and
Koutrakis 2014; Geddes et al. 2016) and regional scales (Liu et al. 2017b; Zhang
et al. 2017). The NO 2 columns increased by 4.07% year
À1 in warm months during
2005–2011 and decreased by À3.62% year
À1 during 2011–2015 (Liu et al. 2017c).
The correlation between satellite-derived surface NO 2 concentrations and measured
NO 2 concentrations in NNDMN was 0.94 (slope ¼ 1.0) (Zhang et al. 2017). The
average of measured monthly surface NO 2 concentrations was 6.83 μg N m
À3
(0.47–16.28 μg N m
À3 ), while the average of satellite-derived NO 2 concentrations
at the measured sites was 6.35 μg N m
À3 (0.23–16.16 μg N m
À3 ). Ground measurements of NO 3
À concentrations can be also estimated based on satellite NO 2 observations combining NO 2 vertical profiles and ground-based sources (Liu et al.
Fig. 3.2 Spatial maps of NH 3 (a) and NO 2 (b) columns (molecules cm
À2 year
À1
). (This figure was
adapted from Liu et al. 2017a under Creative Commons Attribution License)
3 Monitoring Atmospheric Nitrogen Deposition in China
51
(SCIAMACHY) (Liu et al. 2017a, b).
Figure 3.2 shows the IASI NH 3 columns (a) and the OMI NO 2 columns (b) in
China. High NH 3 columns were concentrated in agricultural regions in North China
and South China, consistant with the distribution of surface measured NH 3 hotspots
across China (Pan et al. 2018). Low ground NH 3 concentrations are predominantly
located on the Tibetan Plateau, where the use of synthetic fertilizers and livestock
waste was least among China’s 32 provinces. The satellite-retrieved NH 3 columns
increased by 2.37% year
À1 in the warmer months during 2008–2014 (Liu et al.
2017c), but the percent increase by year (2.37% year
À1 ) was lower than that for NO 2
(4.07% year
À1 ) during 2005–2011. The correlation between IASI-derived surface
NH 3 concentrations and the measured NH 3 concentrations in NNDMN was 0.81
(slope ¼ 0.96) (Liu et al. 2017d). The spatial ground NH 3 concentrations revealed
considerable heterogeneity across China, matching farmland areas, reflecting
China’s unique agricultural structure and farming practice.
Highest NO 2 concentrations were observed in the Yangtze River Delta and
northern China (Fig. 3.2b). There are also small hotspots in Pearl River Delta,
Sichuan Basin and Urumqi. The methods of estimating ground NO 2 concentrations
using satellite measurements in combination with simulations from the chemical
transport model have been investigated at both global (Cheng et al. 2013; Lee and
Koutrakis 2014; Geddes et al. 2016) and regional scales (Liu et al. 2017b; Zhang
et al. 2017). The NO 2 columns increased by 4.07% year
À1 in warm months during
2005–2011 and decreased by À3.62% year
À1 during 2011–2015 (Liu et al. 2017c).
The correlation between satellite-derived surface NO 2 concentrations and measured
NO 2 concentrations in NNDMN was 0.94 (slope ¼ 1.0) (Zhang et al. 2017). The
average of measured monthly surface NO 2 concentrations was 6.83 μg N m
À3
(0.47–16.28 μg N m
À3 ), while the average of satellite-derived NO 2 concentrations
at the measured sites was 6.35 μg N m
À3 (0.23–16.16 μg N m
À3 ). Ground measurements of NO 3
À concentrations can be also estimated based on satellite NO 2 observations combining NO 2 vertical profiles and ground-based sources (Liu et al.
Fig. 3.2 Spatial maps of NH 3 (a) and NO 2 (b) columns (molecules cm
À2 year
À1
). (This figure was
adapted from Liu et al. 2017a under Creative Commons Attribution License)
3 Monitoring Atmospheric Nitrogen Deposition in China
51