

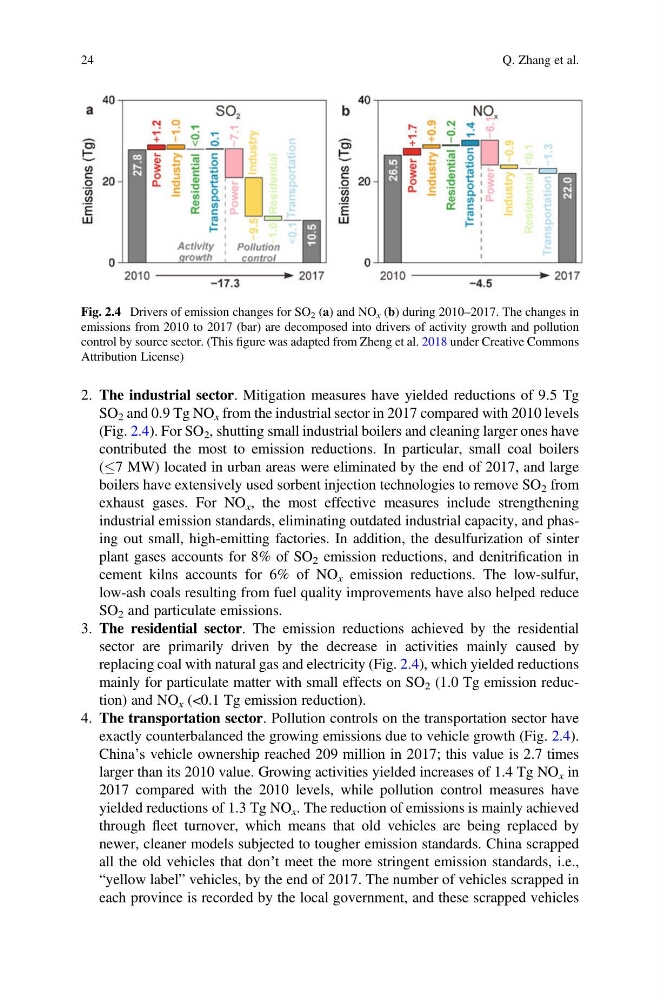
2. The industrial sector. Mitigation measures have yielded reductions of 9.5 Tg
SO 2 and 0.9 Tg NO x from the industrial sector in 2017 compared with 2010 levels
(Fig. 2.4). For SO 2 , shutting small industrial boilers and cleaning larger ones have
contributed the most to emission reductions. In particular, small coal boilers
( 7 MW) located in urban areas were eliminated by the end of 2017, and large
boilers have extensively used sorbent injection technologies to remove SO 2 from
exhaust gases. For NO x , the most effective measures include strengthening
industrial emission standards, eliminating outdated industrial capacity, and phasing out small, high-emitting factories. In addition, the desulfurization of sinter
plant gases accounts for 8% of SO 2 emission reductions, and denitrification in
cement kilns accounts for 6% of NO x emission reductions. The low-sulfur,
low-ash coals resulting from fuel quality improvements have also helped reduce
SO 2 and particulate emissions.
3. The residential sector. The emission reductions achieved by the residential
sector are primarily driven by the decrease in activities mainly caused by
replacing coal with natural gas and electricity (Fig. 2.4), which yielded reductions
mainly for particulate matter with small effects on SO 2 (1.0 Tg emission reduction) and NO x (<0.1 Tg emission reduction).
4. The transportation sector. Pollution controls on the transportation sector have
exactly counterbalanced the growing emissions due to vehicle growth (Fig. 2.4).
China’s vehicle ownership reached 209 million in 2017; this value is 2.7 times
larger than its 2010 value. Growing activities yielded increases of 1.4 Tg NO x in
2017 compared with the 2010 levels, while pollution control measures have
yielded reductions of 1.3 Tg NO x . The reduction of emissions is mainly achieved
through fleet turnover, which means that old vehicles are being replaced by
newer, cleaner models subjected to tougher emission standards. China scrapped
all the old vehicles that don’t meet the more stringent emission standards, i.e.,
“yellow label” vehicles, by the end of 2017. The number of vehicles scrapped in
each province is recorded by the local government, and these scrapped vehicles
Fig. 2.4 Drivers of emission changes for SO 2 (a) and NO x (b) during 2010–2017. The changes in
emissions from 2010 to 2017 (bar) are decomposed into drivers of activity growth and pollution
control by source sector. (This figure was adapted from Zheng et al. 2018 under Creative Commons
Attribution License)
24
Q. Zhang et al.
SO 2 and 0.9 Tg NO x from the industrial sector in 2017 compared with 2010 levels
(Fig. 2.4). For SO 2 , shutting small industrial boilers and cleaning larger ones have
contributed the most to emission reductions. In particular, small coal boilers
( 7 MW) located in urban areas were eliminated by the end of 2017, and large
boilers have extensively used sorbent injection technologies to remove SO 2 from
exhaust gases. For NO x , the most effective measures include strengthening
industrial emission standards, eliminating outdated industrial capacity, and phasing out small, high-emitting factories. In addition, the desulfurization of sinter
plant gases accounts for 8% of SO 2 emission reductions, and denitrification in
cement kilns accounts for 6% of NO x emission reductions. The low-sulfur,
low-ash coals resulting from fuel quality improvements have also helped reduce
SO 2 and particulate emissions.
3. The residential sector. The emission reductions achieved by the residential
sector are primarily driven by the decrease in activities mainly caused by
replacing coal with natural gas and electricity (Fig. 2.4), which yielded reductions
mainly for particulate matter with small effects on SO 2 (1.0 Tg emission reduction) and NO x (<0.1 Tg emission reduction).
4. The transportation sector. Pollution controls on the transportation sector have
exactly counterbalanced the growing emissions due to vehicle growth (Fig. 2.4).
China’s vehicle ownership reached 209 million in 2017; this value is 2.7 times
larger than its 2010 value. Growing activities yielded increases of 1.4 Tg NO x in
2017 compared with the 2010 levels, while pollution control measures have
yielded reductions of 1.3 Tg NO x . The reduction of emissions is mainly achieved
through fleet turnover, which means that old vehicles are being replaced by
newer, cleaner models subjected to tougher emission standards. China scrapped
all the old vehicles that don’t meet the more stringent emission standards, i.e.,
“yellow label” vehicles, by the end of 2017. The number of vehicles scrapped in
each province is recorded by the local government, and these scrapped vehicles
Fig. 2.4 Drivers of emission changes for SO 2 (a) and NO x (b) during 2010–2017. The changes in
emissions from 2010 to 2017 (bar) are decomposed into drivers of activity growth and pollution
control by source sector. (This figure was adapted from Zheng et al. 2018 under Creative Commons
Attribution License)
24
Q. Zhang et al.