

from watershed runoff was at least 141.1 t N in the period of 2010–2011, accounting
for 12.6% of wet N deposition over the watersheds (excluding the area of
1088.6 km
2 controlled by 10 large-/medium-sized reservoirs that have no outflow
for downstream rivers and the area of Lake Dianchi [310 km
2 ]). This result is
comparable to that in forested or agricultural watersheds in Southern China (Shen
et al. 2014). Accordingly, the contribution of annual N deposition to total N loads
increases from 16% to >18% after the inclusion of indirect contribution of N
deposition. It should be noted that such an indirect contribution of the runoff of
atmospheric N deposition from watersheds contained some uncertainties in NO 3
À -N
concentration of wet deposition over the watersheds away from the lake and in the
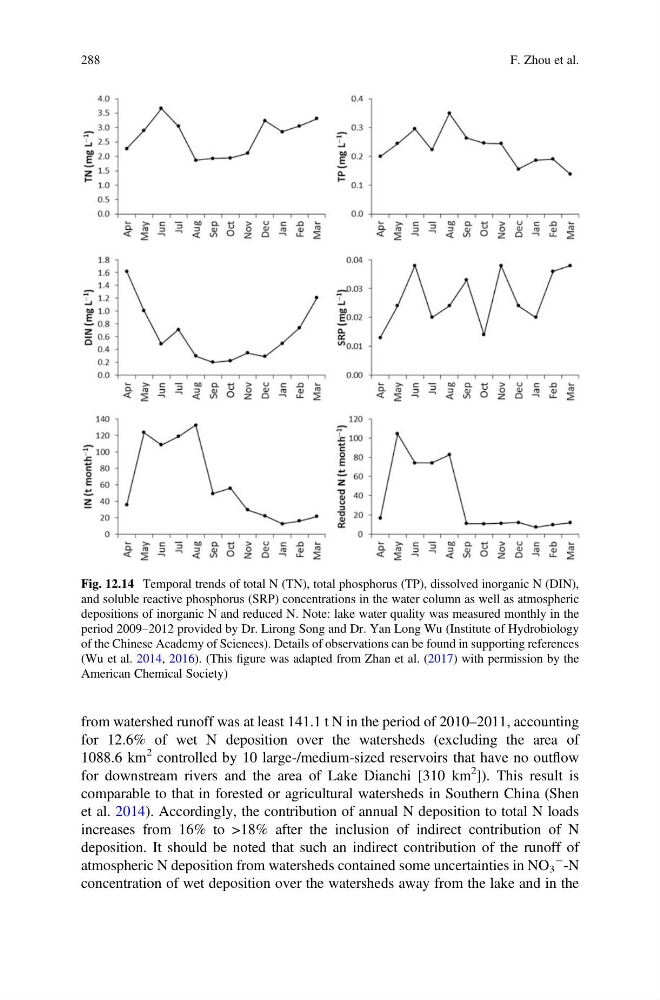
Fig. 12.14 Temporal trends of total N (TN), total phosphorus (TP), dissolved inorganic N (DIN),
and soluble reactive phosphorus (SRP) concentrations in the water column as well as atmospheric
depositions of inorganic N and reduced N. Note: lake water quality was measured monthly in the
period 2009–2012 provided by Dr. Lirong Song and Dr. Yan Long Wu (Institute of Hydrobiology
of the Chinese Academy of Sciences). Details of observations can be found in supporting references
(Wu et al. 2014, 2016). (This figure was adapted from Zhan et al. (2017) with permission by the
American Chemical Society)
288
F. Zhou et al.
for 12.6% of wet N deposition over the watersheds (excluding the area of
1088.6 km
2 controlled by 10 large-/medium-sized reservoirs that have no outflow
for downstream rivers and the area of Lake Dianchi [310 km
2 ]). This result is
comparable to that in forested or agricultural watersheds in Southern China (Shen
et al. 2014). Accordingly, the contribution of annual N deposition to total N loads
increases from 16% to >18% after the inclusion of indirect contribution of N
deposition. It should be noted that such an indirect contribution of the runoff of
atmospheric N deposition from watersheds contained some uncertainties in NO 3
À -N
concentration of wet deposition over the watersheds away from the lake and in the
Fig. 12.14 Temporal trends of total N (TN), total phosphorus (TP), dissolved inorganic N (DIN),
and soluble reactive phosphorus (SRP) concentrations in the water column as well as atmospheric
depositions of inorganic N and reduced N. Note: lake water quality was measured monthly in the
period 2009–2012 provided by Dr. Lirong Song and Dr. Yan Long Wu (Institute of Hydrobiology
of the Chinese Academy of Sciences). Details of observations can be found in supporting references
(Wu et al. 2014, 2016). (This figure was adapted from Zhan et al. (2017) with permission by the
American Chemical Society)
288
F. Zhou et al.