

indicated that wet deposition fluxes were not significantly correlated with N concentrations (r ¼ 0.32, P < 0.001), but it is highly consistent with precipitation over all
five sites (r ¼ 0.83, P < 0.001). The concentrations of three N species at all five sites
can be found in Fig. 12.3. Seasonal changes of NO 3
À -N and ON were analogous to
the total flux of wet deposition, whereas the changes of NH 4
+
-N matched up best
with dry deposition.
For the entire period, the ratio of dry to wet deposition of N was 0.91 but
increased by more than 1.40 in early spring and winter (Fig. 12.6). Although
estimates of NH 3 and wet deposition fluxes inherently contain more uncertainty
from deposition velocities and sampling processes, the ratio of reduced N
(NH 3 +NH 4
+
-N) to oxidized N (NO 2 +NO 3
À -N+HNO 2 /HNO 3 ) in total (wet plus
dry) N deposition fluxes was more than 1.4 (Fig. 12.6). The ratio grew up to
1.7–3.8 in May, early July, and later August (Fig. 12.6). Our ratio was slightly
larger than national averages (Xu et al. 2015) (1.2) but smaller than those reported
for the United States (Li et al. 2016) (1.3–3.5).
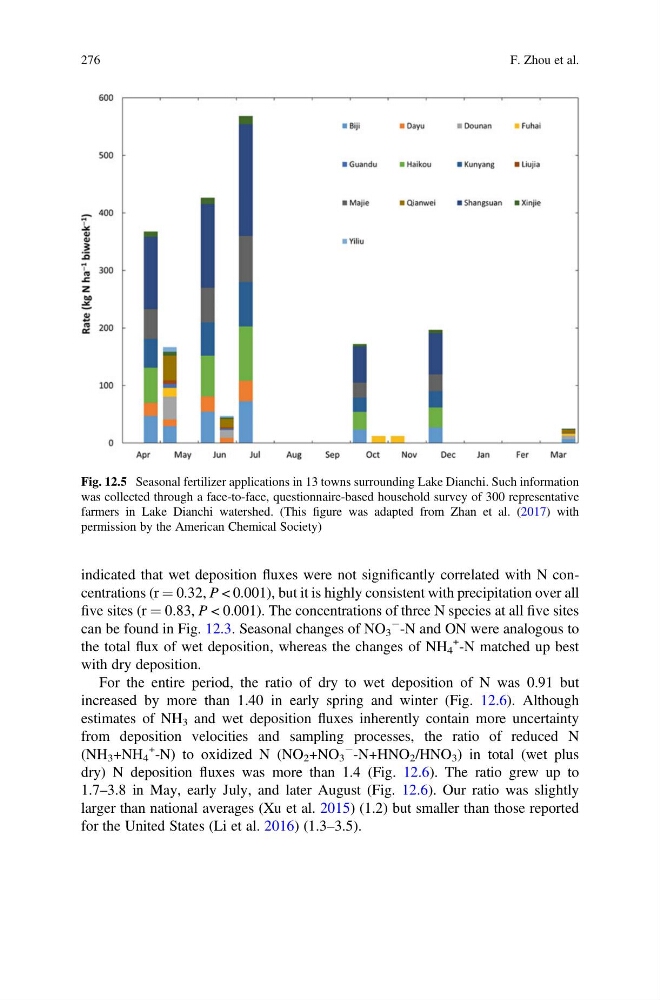
Fig. 12.5 Seasonal fertilizer applications in 13 towns surrounding Lake Dianchi. Such information
was collected through a face-to-face, questionnaire-based household survey of 300 representative
farmers in Lake Dianchi watershed. (This figure was adapted from Zhan et al. (2017) with
permission by the American Chemical Society)
276
F. Zhou et al.
five sites (r ¼ 0.83, P < 0.001). The concentrations of three N species at all five sites
can be found in Fig. 12.3. Seasonal changes of NO 3
À -N and ON were analogous to
the total flux of wet deposition, whereas the changes of NH 4
+
-N matched up best
with dry deposition.
For the entire period, the ratio of dry to wet deposition of N was 0.91 but
increased by more than 1.40 in early spring and winter (Fig. 12.6). Although
estimates of NH 3 and wet deposition fluxes inherently contain more uncertainty
from deposition velocities and sampling processes, the ratio of reduced N
(NH 3 +NH 4
+
-N) to oxidized N (NO 2 +NO 3
À -N+HNO 2 /HNO 3 ) in total (wet plus
dry) N deposition fluxes was more than 1.4 (Fig. 12.6). The ratio grew up to
1.7–3.8 in May, early July, and later August (Fig. 12.6). Our ratio was slightly
larger than national averages (Xu et al. 2015) (1.2) but smaller than those reported
for the United States (Li et al. 2016) (1.3–3.5).
Fig. 12.5 Seasonal fertilizer applications in 13 towns surrounding Lake Dianchi. Such information
was collected through a face-to-face, questionnaire-based household survey of 300 representative
farmers in Lake Dianchi watershed. (This figure was adapted from Zhan et al. (2017) with
permission by the American Chemical Society)
276
F. Zhou et al.