

concentration and rainfall amount for each rainfall event and monitoring site. V d of
gaseous N and particulate N over Lake Dianchi was estimated by a well-tested
deposition velocity model (Kuang et al. 2016) combined with hourly meteorological
data source from a national meteorological station located at the north end of Lake
Dianchi (Fig. 12.1). Gas V d over Lake Dianchi was calculated using the big-leaf
resistance analogy model (Wesely and Hicks 1977) as
V d ¼ 1= R a þ R b þ R c
ð
Þ
ð 12:1Þ
where R a is the aerodynamic resistance, R b is the quasi laminar boundary layer
resistance, and R c is the surface resistance.
The parameterization of R a is calculated according to Erisman and Draaijers
(1995) as
R s z
ð Þ ¼ ku Ã
ð Þ
À1 ln
z À d
z0
À Ψ
z À d
L
þ Ψh
z0
L
!
ð12:2Þ
where z is the measuring sensor height, k is the von Karman constant (0.41), u à is the
friction velocity, d is the zero plane displacement height, z0 is the roughness
length, ψ h is the integrated stability functions for entrained scalars, and L is the
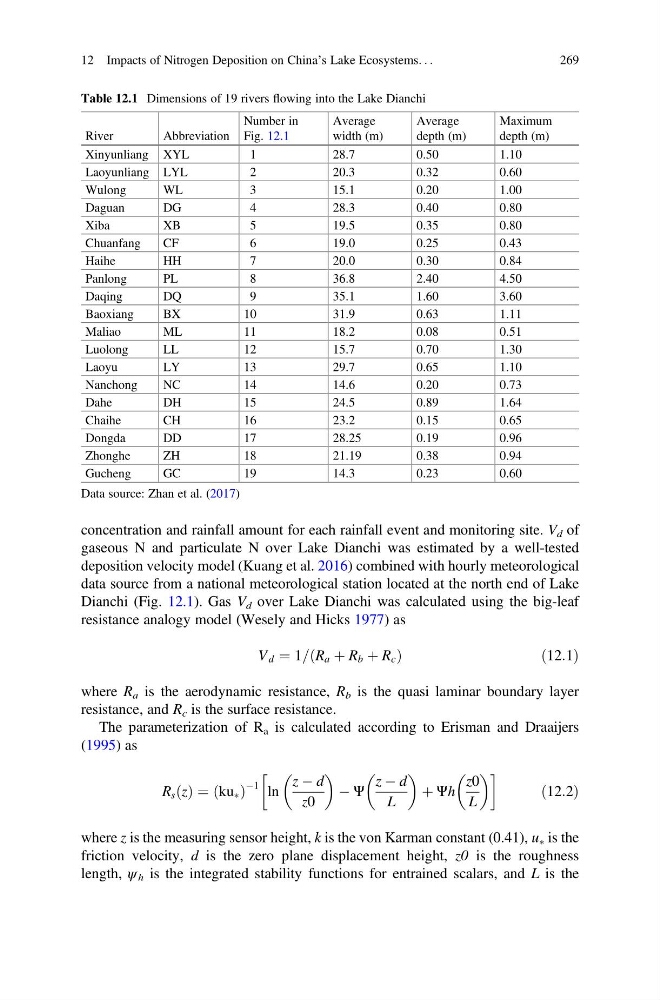
Table 12.1 Dimensions of 19 rivers flowing into the Lake Dianchi
River
Abbreviation
Number in
Fig. 12.1
Average
width (m)
Average
depth (m)
Maximum
depth (m)
Xinyunliang XYL
1
28.7
0.50
1.10
Laoyunliang LYL
2
20.3
0.32
0.60
Wulong
WL
3
15.1
0.20
1.00
Daguan
DG
4
28.3
0.40
0.80
Xiba
XB
5
19.5
0.35
0.80
Chuanfang
CF
6
19.0
0.25
0.43
Haihe
HH
7
20.0
0.30
0.84
Panlong
PL
8
36.8
2.40
4.50
Daqing
DQ
9
35.1
1.60
3.60
Baoxiang
BX
10
31.9
0.63
1.11
Maliao
ML
11
18.2
0.08
0.51
Luolong
LL
12
15.7
0.70
1.30
Laoyu
LY
13
29.7
0.65
1.10
Nanchong
NC
14
14.6
0.20
0.73
Dahe
DH
15
24.5
0.89
1.64
Chaihe
CH
16
23.2
0.15
0.65
Dongda
DD
17
28.25
0.19
0.96
Zhonghe
ZH
18
21.19
0.38
0.94
Gucheng
GC
19
14.3
0.23
0.60
Data source: Zhan et al. (2017)
12 Impacts of Nitrogen Deposition on China’s Lake Ecosystems. . .
269
gaseous N and particulate N over Lake Dianchi was estimated by a well-tested
deposition velocity model (Kuang et al. 2016) combined with hourly meteorological
data source from a national meteorological station located at the north end of Lake
Dianchi (Fig. 12.1). Gas V d over Lake Dianchi was calculated using the big-leaf
resistance analogy model (Wesely and Hicks 1977) as
V d ¼ 1= R a þ R b þ R c
ð
Þ
ð 12:1Þ
where R a is the aerodynamic resistance, R b is the quasi laminar boundary layer
resistance, and R c is the surface resistance.
The parameterization of R a is calculated according to Erisman and Draaijers
(1995) as
R s z
ð Þ ¼ ku Ã
ð Þ
À1 ln
z À d
z0
À Ψ
z À d
L
þ Ψh
z0
L
!
ð12:2Þ
where z is the measuring sensor height, k is the von Karman constant (0.41), u à is the
friction velocity, d is the zero plane displacement height, z0 is the roughness
length, ψ h is the integrated stability functions for entrained scalars, and L is the
Table 12.1 Dimensions of 19 rivers flowing into the Lake Dianchi
River
Abbreviation
Number in
Fig. 12.1
Average
width (m)
Average
depth (m)
Maximum
depth (m)
Xinyunliang XYL
1
28.7
0.50
1.10
Laoyunliang LYL
2
20.3
0.32
0.60
Wulong
WL
3
15.1
0.20
1.00
Daguan
DG
4
28.3
0.40
0.80
Xiba
XB
5
19.5
0.35
0.80
Chuanfang
CF
6
19.0
0.25
0.43
Haihe
HH
7
20.0
0.30
0.84
Panlong
PL
8
36.8
2.40
4.50
Daqing
DQ
9
35.1
1.60
3.60
Baoxiang
BX
10
31.9
0.63
1.11
Maliao
ML
11
18.2
0.08
0.51
Luolong
LL
12
15.7
0.70
1.30
Laoyu
LY
13
29.7
0.65
1.10
Nanchong
NC
14
14.6
0.20
0.73
Dahe
DH
15
24.5
0.89
1.64
Chaihe
CH
16
23.2
0.15
0.65
Dongda
DD
17
28.25
0.19
0.96
Zhonghe
ZH
18
21.19
0.38
0.94
Gucheng
GC
19
14.3
0.23
0.60
Data source: Zhan et al. (2017)
12 Impacts of Nitrogen Deposition on China’s Lake Ecosystems. . .
269