

such as total phosphorus (P), potassium (K), available K, and organic matter, were
not changed with increasing N additions (Zhang 2014; Zhou et al. 2012).The
magnitude of N added effects on soil physicochemical characteristics depended on
the rates of N additions. For example, available P firstly increased and then
decreased with increasing rates of N input (Zhou et al. 2012). Soil pH was usually
reduced under the N addition (Su et al. 2014a; Zhou et al. 2012), although some
neutral effects were observed (Zhang 2014), which means that soil acidification
occurred to certain extent under N addition. Nitrogen addition led to increases in soil
electrical conductivity, which may cause toxic effects on soil microbial activity
(Zhou et al. 2012).
Although the soil C/N/P stoichiometry was rarely affected by short-term N
addition, N concentrations in green leaves or aboveground parts increased with N
additions (Huang and Yu 2016; Li 2014; Wang 2012). Leaf N concentrations in both
herbaceous and shrub species significantly increased with N addition (Cui et al.
2018a). The increased N concentrations and higher N/P in fine roots were also found
(Li et al. 2017). These results suggest that N addition can increase plant N uptake in
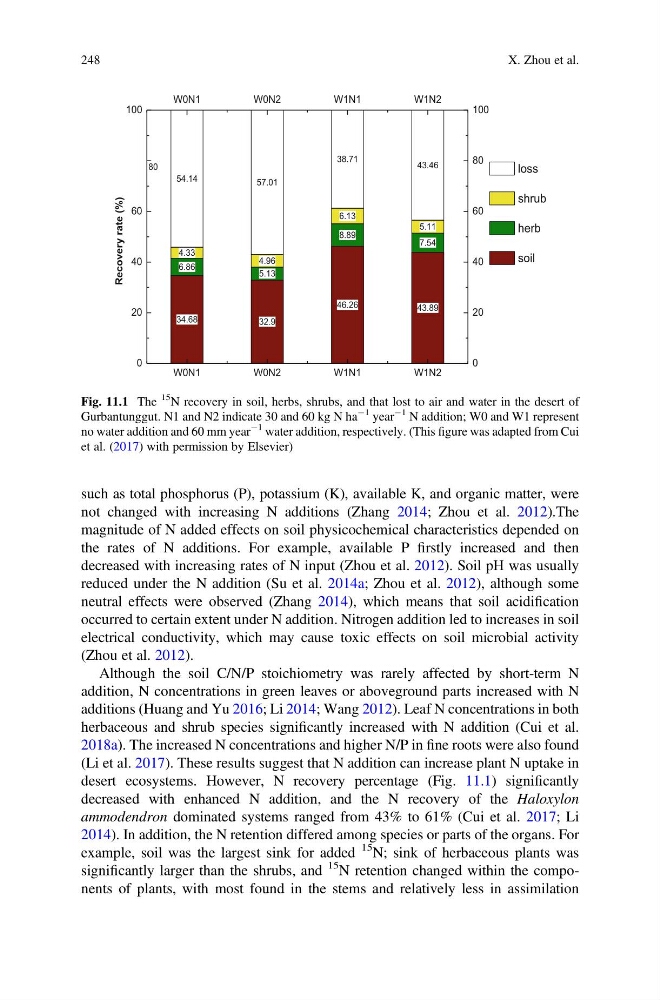
desert ecosystems. However, N recovery percentage (Fig. 11.1) significantly
decreased with enhanced N addition, and the N recovery of the Haloxylon
ammodendron dominated systems ranged from 43% to 61% (Cui et al. 2017; Li
2014). In addition, the N retention differed among species or parts of the organs. For
example, soil was the largest sink for added
15 N; sink of herbaceous plants was
significantly larger than the shrubs, and
15 N retention changed within the components of plants, with most found in the stems and relatively less in assimilation
34.68
32.9
46.26
43.89
6.86
5.13
8.89
7.54
4.33
4.96
6.13
5.11
54.14
57.01
38.71
43.46
W0N1
W0N2
W1N1
W1N2
0
20
40
60
80
100
W0N1
W0N2
W1N1
W1N2
0
20
40
60
80
100
)
%
(
e
t
a
r
y
r
e
v
o
c
e
R
loss
shrub
herb
soil
Fig. 11.1 The
15 N recovery in soil, herbs, shrubs, and that lost to air and water in the desert of
Gurbantunggut. N1 and N2 indicate 30 and 60 kg N ha
À1 year
À1 N addition; W0 and W1 represent
no water addition and 60 mm year
À1 water addition, respectively. (This figure was adapted from Cui
et al. (2017) with permission by Elsevier)
248
X. Zhou et al.
not changed with increasing N additions (Zhang 2014; Zhou et al. 2012).The
magnitude of N added effects on soil physicochemical characteristics depended on
the rates of N additions. For example, available P firstly increased and then
decreased with increasing rates of N input (Zhou et al. 2012). Soil pH was usually
reduced under the N addition (Su et al. 2014a; Zhou et al. 2012), although some
neutral effects were observed (Zhang 2014), which means that soil acidification
occurred to certain extent under N addition. Nitrogen addition led to increases in soil
electrical conductivity, which may cause toxic effects on soil microbial activity
(Zhou et al. 2012).
Although the soil C/N/P stoichiometry was rarely affected by short-term N
addition, N concentrations in green leaves or aboveground parts increased with N
additions (Huang and Yu 2016; Li 2014; Wang 2012). Leaf N concentrations in both
herbaceous and shrub species significantly increased with N addition (Cui et al.
2018a). The increased N concentrations and higher N/P in fine roots were also found
(Li et al. 2017). These results suggest that N addition can increase plant N uptake in
desert ecosystems. However, N recovery percentage (Fig. 11.1) significantly
decreased with enhanced N addition, and the N recovery of the Haloxylon
ammodendron dominated systems ranged from 43% to 61% (Cui et al. 2017; Li
2014). In addition, the N retention differed among species or parts of the organs. For
example, soil was the largest sink for added
15 N; sink of herbaceous plants was
significantly larger than the shrubs, and
15 N retention changed within the components of plants, with most found in the stems and relatively less in assimilation
34.68
32.9
46.26
43.89
6.86
5.13
8.89
7.54
4.33
4.96
6.13
5.11
54.14
57.01
38.71
43.46
W0N1
W0N2
W1N1
W1N2
0
20
40
60
80
100
W0N1
W0N2
W1N1
W1N2
0
20
40
60
80
100
)
%
(
e
t
a
r
y
r
e
v
o
c
e
R
loss
shrub
herb
soil
Fig. 11.1 The
15 N recovery in soil, herbs, shrubs, and that lost to air and water in the desert of
Gurbantunggut. N1 and N2 indicate 30 and 60 kg N ha
À1 year
À1 N addition; W0 and W1 represent
no water addition and 60 mm year
À1 water addition, respectively. (This figure was adapted from Cui
et al. (2017) with permission by Elsevier)
248
X. Zhou et al.