

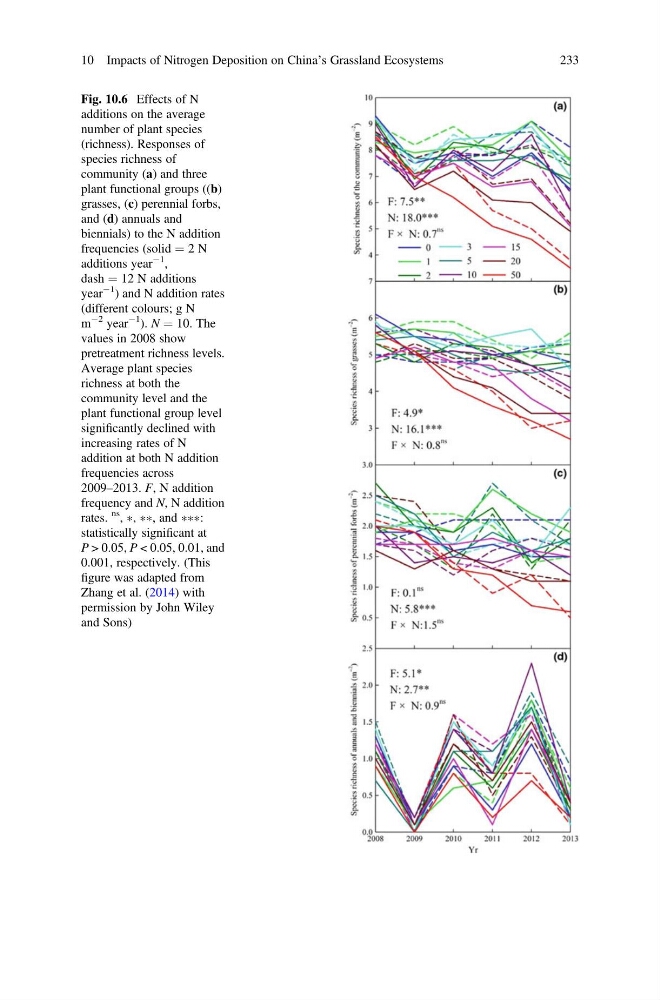
Fig. 10.6 Effects of N
additions on the average
number of plant species
(richness). Responses of
species richness of
community (a) and three
plant functional groups ((b)
grasses, (c) perennial forbs,
and (d) annuals and
biennials) to the N addition
frequencies (solid ¼ 2 N
additions year
À1
,
dash ¼ 12 N additions
year
À1
) and N addition rates
(different colours; g N
m
À2 year
À1
). N ¼ 10. The
values in 2008 show
pretreatment richness levels.
Average plant species
richness at both the
community level and the
plant functional group level
significantly declined with
increasing rates of N
addition at both N addition
frequencies across
2009–2013. F, N addition
frequency and N, N addition
rates.
ns
, Ã, ÃÃ, and ÃÃÃ:
statistically significant at
P > 0.05, P < 0.05, 0.01, and
0.001, respectively. (This
figure was adapted from
Zhang et al. (2014) with
permission by John Wiley
and Sons)
10 Impacts of Nitrogen Deposition on China’s Grassland Ecosystems
233
additions on the average
number of plant species
(richness). Responses of
species richness of
community (a) and three
plant functional groups ((b)
grasses, (c) perennial forbs,
and (d) annuals and
biennials) to the N addition
frequencies (solid ¼ 2 N
additions year
À1
,
dash ¼ 12 N additions
year
À1
) and N addition rates
(different colours; g N
m
À2 year
À1
). N ¼ 10. The
values in 2008 show
pretreatment richness levels.
Average plant species
richness at both the
community level and the
plant functional group level
significantly declined with
increasing rates of N
addition at both N addition
frequencies across
2009–2013. F, N addition
frequency and N, N addition
rates.
ns
, Ã, ÃÃ, and ÃÃÃ:
statistically significant at
P > 0.05, P < 0.05, 0.01, and
0.001, respectively. (This
figure was adapted from
Zhang et al. (2014) with
permission by John Wiley
and Sons)
10 Impacts of Nitrogen Deposition on China’s Grassland Ecosystems
233