

and significantly reduced C:P ratios in both green and senesced leaves and N:P ratios
in green leaves (Lü et al. 2012). Furthermore, N addition may significantly affect
nutrient resorption, an adaptive processes during leaf senescence stage with implications for litter decomposition and nutrient cycling (Aerts and Chapin 2000). You
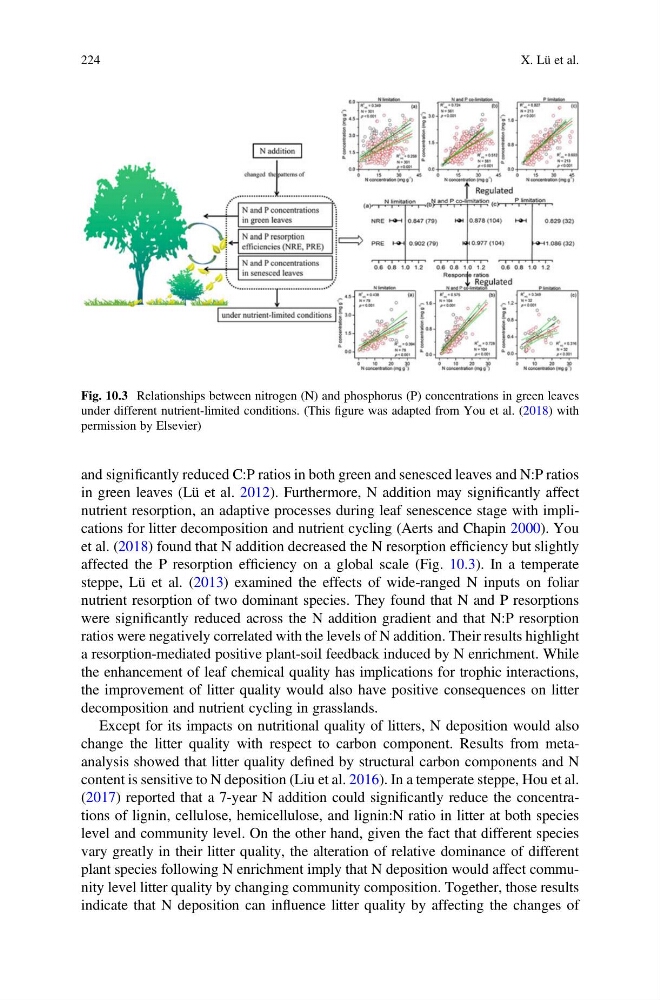
et al. (2018) found that N addition decreased the N resorption efficiency but slightly
affected the P resorption efficiency on a global scale (Fig. 10.3). In a temperate
steppe, Lü et al. (2013) examined the effects of wide-ranged N inputs on foliar
nutrient resorption of two dominant species. They found that N and P resorptions
were significantly reduced across the N addition gradient and that N:P resorption
ratios were negatively correlated with the levels of N addition. Their results highlight
a resorption-mediated positive plant-soil feedback induced by N enrichment. While
the enhancement of leaf chemical quality has implications for trophic interactions,
the improvement of litter quality would also have positive consequences on litter
decomposition and nutrient cycling in grasslands.
Except for its impacts on nutritional quality of litters, N deposition would also
change the litter quality with respect to carbon component. Results from metaanalysis showed that litter quality defined by structural carbon components and N
content is sensitive to N deposition (Liu et al. 2016). In a temperate steppe, Hou et al.
(2017) reported that a 7-year N addition could significantly reduce the concentrations of lignin, cellulose, hemicellulose, and lignin:N ratio in litter at both species
level and community level. On the other hand, given the fact that different species
vary greatly in their litter quality, the alteration of relative dominance of different
plant species following N enrichment imply that N deposition would affect community level litter quality by changing community composition. Together, those results
indicate that N deposition can influence litter quality by affecting the changes of
Fig. 10.3 Relationships between nitrogen (N) and phosphorus (P) concentrations in green leaves
under different nutrient-limited conditions. (This figure was adapted from You et al. (2018) with
permission by Elsevier)
224
X. Lü et al.
in green leaves (Lü et al. 2012). Furthermore, N addition may significantly affect
nutrient resorption, an adaptive processes during leaf senescence stage with implications for litter decomposition and nutrient cycling (Aerts and Chapin 2000). You
et al. (2018) found that N addition decreased the N resorption efficiency but slightly
affected the P resorption efficiency on a global scale (Fig. 10.3). In a temperate
steppe, Lü et al. (2013) examined the effects of wide-ranged N inputs on foliar
nutrient resorption of two dominant species. They found that N and P resorptions
were significantly reduced across the N addition gradient and that N:P resorption
ratios were negatively correlated with the levels of N addition. Their results highlight
a resorption-mediated positive plant-soil feedback induced by N enrichment. While
the enhancement of leaf chemical quality has implications for trophic interactions,
the improvement of litter quality would also have positive consequences on litter
decomposition and nutrient cycling in grasslands.
Except for its impacts on nutritional quality of litters, N deposition would also
change the litter quality with respect to carbon component. Results from metaanalysis showed that litter quality defined by structural carbon components and N
content is sensitive to N deposition (Liu et al. 2016). In a temperate steppe, Hou et al.
(2017) reported that a 7-year N addition could significantly reduce the concentrations of lignin, cellulose, hemicellulose, and lignin:N ratio in litter at both species
level and community level. On the other hand, given the fact that different species
vary greatly in their litter quality, the alteration of relative dominance of different
plant species following N enrichment imply that N deposition would affect community level litter quality by changing community composition. Together, those results
indicate that N deposition can influence litter quality by affecting the changes of
Fig. 10.3 Relationships between nitrogen (N) and phosphorus (P) concentrations in green leaves
under different nutrient-limited conditions. (This figure was adapted from You et al. (2018) with
permission by Elsevier)
224
X. Lü et al.