

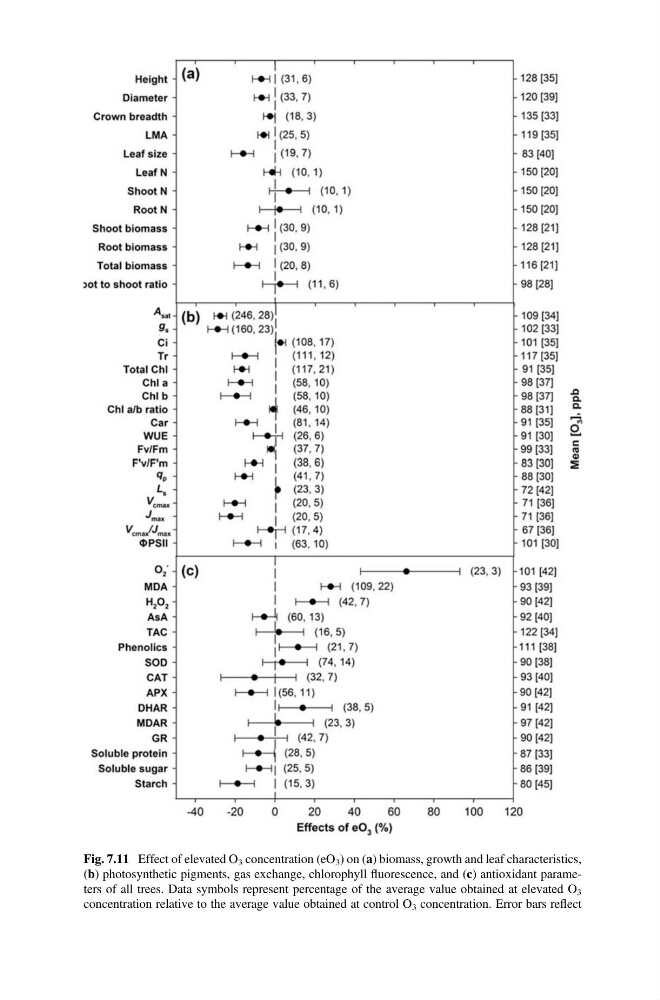
Fig. 7.11 Effect of elevated O 3 concentration (eO 3 ) on (a) biomass, growth and leaf characteristics,
(b) photosynthetic pigments, gas exchange, chlorophyll fluorescence, and (c) antioxidant parameters of all trees. Data symbols represent percentage of the average value obtained at elevated O 3
concentration relative to the average value obtained at control O 3 concentration. Error bars reflect
(b) photosynthetic pigments, gas exchange, chlorophyll fluorescence, and (c) antioxidant parameters of all trees. Data symbols represent percentage of the average value obtained at elevated O 3
concentration relative to the average value obtained at control O 3 concentration. Error bars reflect