

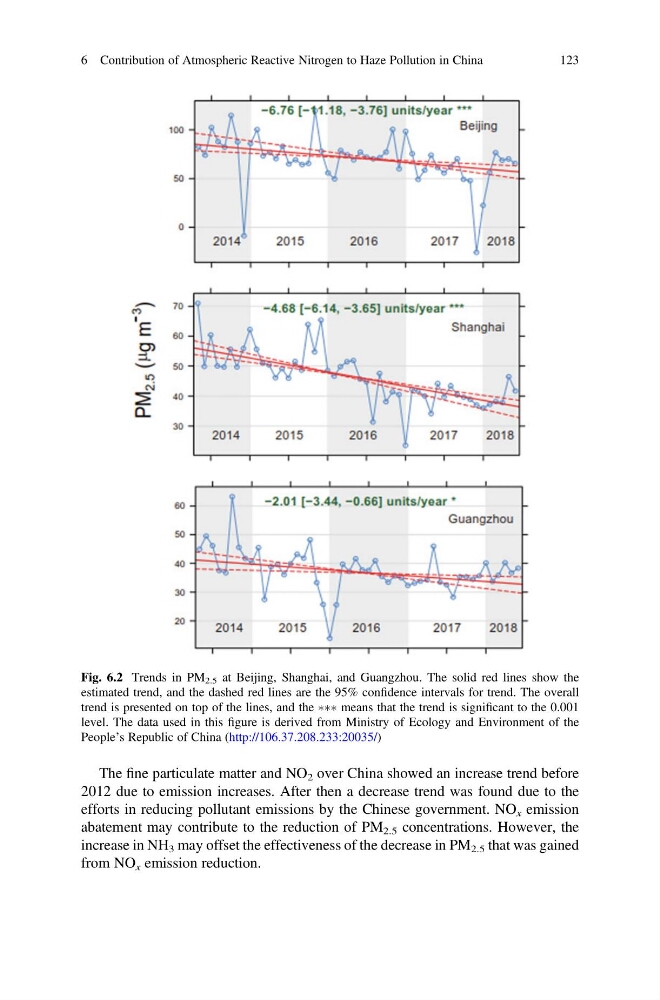
The fine particulate matter and NO 2 over China showed an increase trend before
2012 due to emission increases. After then a decrease trend was found due to the
efforts in reducing pollutant emissions by the Chinese government. NO x emission
abatement may contribute to the reduction of PM 2.5 concentrations. However, the
increase in NH 3 may offset the effectiveness of the decrease in PM 2.5 that was gained
from NO x emission reduction.
Fig. 6.2 Trends in PM 2.5 at Beijing, Shanghai, and Guangzhou. The solid red lines show the
estimated trend, and the dashed red lines are the 95% confidence intervals for trend. The overall
trend is presented on top of the lines, and the ÃÃÃ means that the trend is significant to the 0.001
level. The data used in this figure is derived from Ministry of Ecology and Environment of the
People’s Republic of China (http://106.37.208.233:20035/)
6 Contribution of Atmospheric Reactive Nitrogen to Haze Pollution in China
123
2012 due to emission increases. After then a decrease trend was found due to the
efforts in reducing pollutant emissions by the Chinese government. NO x emission
abatement may contribute to the reduction of PM 2.5 concentrations. However, the
increase in NH 3 may offset the effectiveness of the decrease in PM 2.5 that was gained
from NO x emission reduction.
Fig. 6.2 Trends in PM 2.5 at Beijing, Shanghai, and Guangzhou. The solid red lines show the
estimated trend, and the dashed red lines are the 95% confidence intervals for trend. The overall
trend is presented on top of the lines, and the ÃÃÃ means that the trend is significant to the 0.001
level. The data used in this figure is derived from Ministry of Ecology and Environment of the
People’s Republic of China (http://106.37.208.233:20035/)
6 Contribution of Atmospheric Reactive Nitrogen to Haze Pollution in China
123