

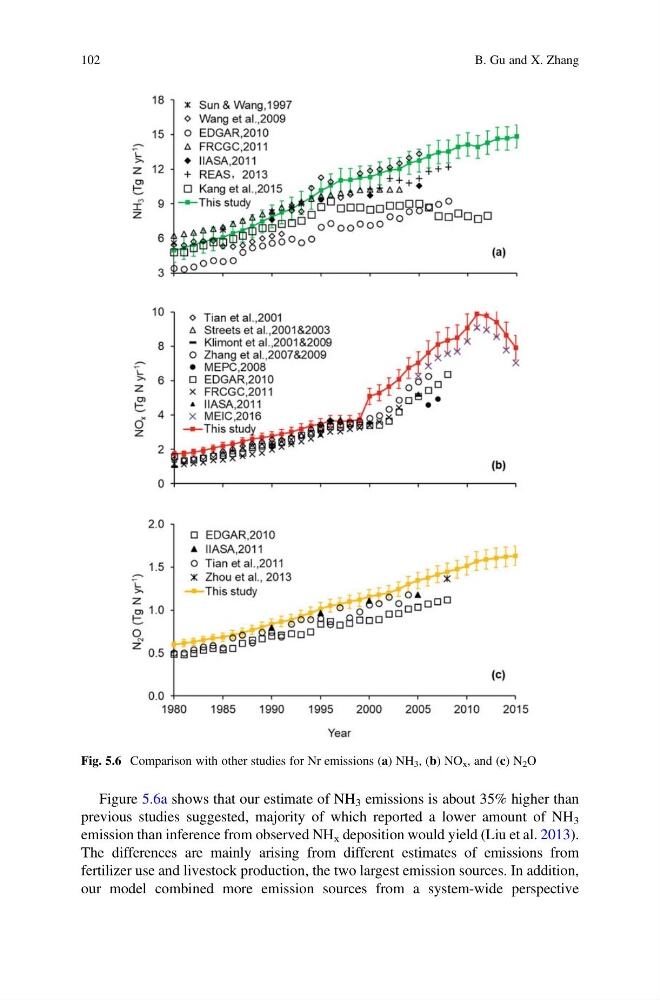
Figure 5.6a shows that our estimate of NH 3 emissions is about 35% higher than
previous studies suggested, majority of which reported a lower amount of NH 3
emission than inference from observed NH x deposition would yield (Liu et al. 2013).
The differences are mainly arising from different estimates of emissions from
fertilizer use and livestock production, the two largest emission sources. In addition,
our model combined more emission sources from a system-wide perspective
Fig. 5.6 Comparison with other studies for Nr emissions (a) NH 3 , (b) NO x , and (c) N 2 O
102
B. Gu and X. Zhang
previous studies suggested, majority of which reported a lower amount of NH 3
emission than inference from observed NH x deposition would yield (Liu et al. 2013).
The differences are mainly arising from different estimates of emissions from
fertilizer use and livestock production, the two largest emission sources. In addition,
our model combined more emission sources from a system-wide perspective
Fig. 5.6 Comparison with other studies for Nr emissions (a) NH 3 , (b) NO x , and (c) N 2 O
102
B. Gu and X. Zhang