

Total NH 3 emissions in China have continued to grow over the last 35 years,
boosting from 5.0 Tg N year
À1 in 1980 to 14.8 Tg N year
À1 in 2015 at an annual rate
of 3%. NH 3 emission level estimated by our model is consistent with the measured
deposition of NH x on land (11–14 Tg N year
À1 from 2000 to 2015) in mainland
China and the substantial increases in NH 3 concentrations observed by satellite
measurements (IASI & AIRS) over China (Zhang et al. 2017). Agricultural sources
were the largest contributors, accounting for ~90% of total NH 3 emissions, with
5.8 Tg N and 5.9 Tg N stemming from cropping system and livestock production in
2015, respectively. The majority of the NH 3 emissions from cropland originated
from the application of mineral fertilizers (5.4 Tg N), and the rest from irrigation,
agricultural soils, N-fixing crops, and composting of crop residues. An estimated
3.8 Tg N was emitted from livestock housing and manure storage. In addition, 2.1 Tg
N was emitted from manure application to cropland, which in some studies has been
attributed to cropland emissions (Xu et al. 2015, 2016).
NO x emissions in China have increased rapidly due to economic development
and urbanization since 2000. It increased from 1.8 Tg N year
À1 in 1980 to 5.1 Tg N
year
À1 in 2000, then rapidly increased to 9.0 Tg N year
À1 in 2011, and then
decreased to 7.9 Tg N year
À1 in 2015, coinciding with China’s enforcement of its
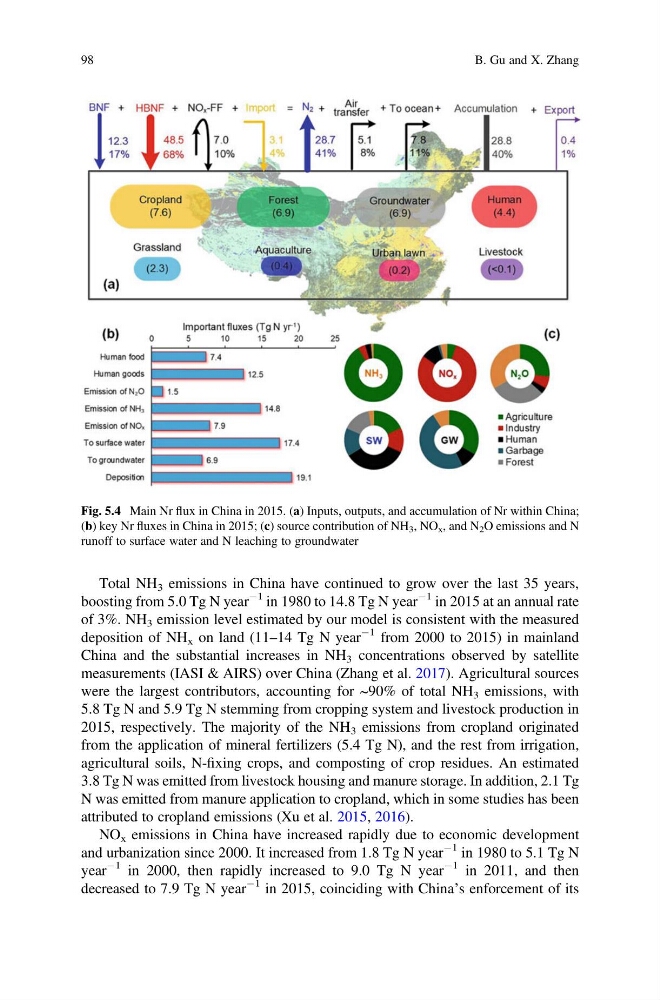
Fig. 5.4 Main Nr flux in China in 2015. (a) Inputs, outputs, and accumulation of Nr within China;
(b) key Nr fluxes in China in 2015; (c) source contribution of NH 3 , NO x , and N 2 O emissions and N
runoff to surface water and N leaching to groundwater
98
B. Gu and X. Zhang
boosting from 5.0 Tg N year
À1 in 1980 to 14.8 Tg N year
À1 in 2015 at an annual rate
of 3%. NH 3 emission level estimated by our model is consistent with the measured
deposition of NH x on land (11–14 Tg N year
À1 from 2000 to 2015) in mainland
China and the substantial increases in NH 3 concentrations observed by satellite
measurements (IASI & AIRS) over China (Zhang et al. 2017). Agricultural sources
were the largest contributors, accounting for ~90% of total NH 3 emissions, with
5.8 Tg N and 5.9 Tg N stemming from cropping system and livestock production in
2015, respectively. The majority of the NH 3 emissions from cropland originated
from the application of mineral fertilizers (5.4 Tg N), and the rest from irrigation,
agricultural soils, N-fixing crops, and composting of crop residues. An estimated
3.8 Tg N was emitted from livestock housing and manure storage. In addition, 2.1 Tg
N was emitted from manure application to cropland, which in some studies has been
attributed to cropland emissions (Xu et al. 2015, 2016).
NO x emissions in China have increased rapidly due to economic development
and urbanization since 2000. It increased from 1.8 Tg N year
À1 in 1980 to 5.1 Tg N
year
À1 in 2000, then rapidly increased to 9.0 Tg N year
À1 in 2011, and then
decreased to 7.9 Tg N year
À1 in 2015, coinciding with China’s enforcement of its
Fig. 5.4 Main Nr flux in China in 2015. (a) Inputs, outputs, and accumulation of Nr within China;
(b) key Nr fluxes in China in 2015; (c) source contribution of NH 3 , NO x , and N 2 O emissions and N
runoff to surface water and N leaching to groundwater
98
B. Gu and X. Zhang