

The Others subsystem in Fig. 5.2 represents a combination of other six subsystems that have smaller and/or more limited connections to the cropland, industry,
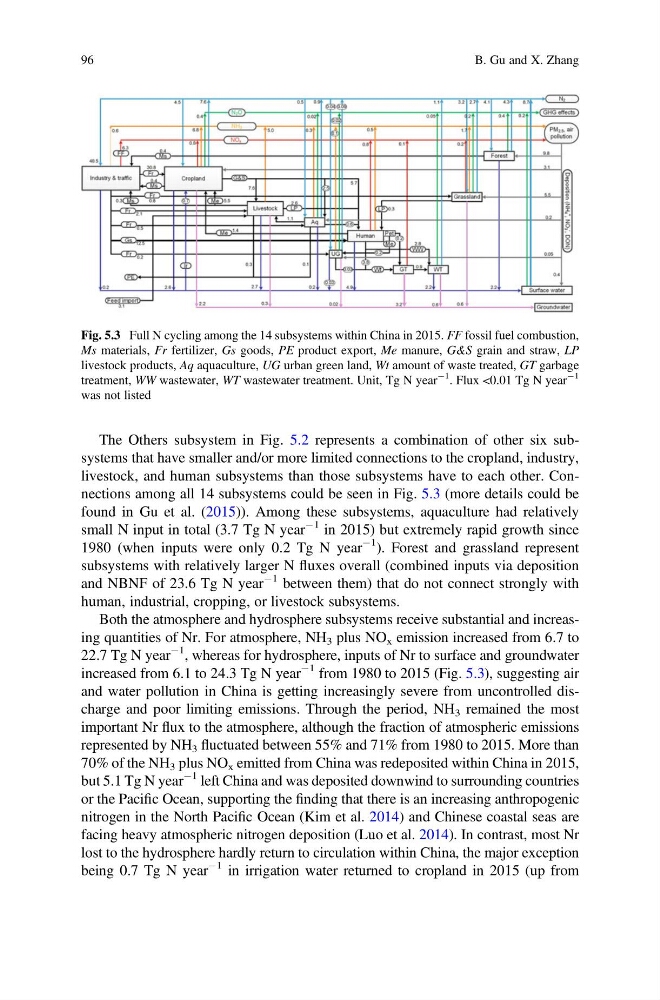
livestock, and human subsystems than those subsystems have to each other. Connections among all 14 subsystems could be seen in Fig. 5.3 (more details could be
found in Gu et al. (2015)). Among these subsystems, aquaculture had relatively
small N input in total (3.7 Tg N year
À1 in 2015) but extremely rapid growth since
1980 (when inputs were only 0.2 Tg N year
À1 ). Forest and grassland represent
subsystems with relatively larger N fluxes overall (combined inputs via deposition
and NBNF of 23.6 Tg N year
À1 between them) that do not connect strongly with
human, industrial, cropping, or livestock subsystems.
Both the atmosphere and hydrosphere subsystems receive substantial and increasing quantities of Nr. For atmosphere, NH 3 plus NO x emission increased from 6.7 to
22.7 Tg N year
À1
, whereas for hydrosphere, inputs of Nr to surface and groundwater
increased from 6.1 to 24.3 Tg N year
À1 from 1980 to 2015 (Fig. 5.3), suggesting air
and water pollution in China is getting increasingly severe from uncontrolled discharge and poor limiting emissions. Through the period, NH 3 remained the most
important Nr flux to the atmosphere, although the fraction of atmospheric emissions
represented by NH 3 fluctuated between 55% and 71% from 1980 to 2015. More than
70% of the NH 3 plus NO x emitted from China was redeposited within China in 2015,
but 5.1 Tg N year
À1 left China and was deposited downwind to surrounding countries
or the Pacific Ocean, supporting the finding that there is an increasing anthropogenic
nitrogen in the North Pacific Ocean (Kim et al. 2014) and Chinese coastal seas are
facing heavy atmospheric nitrogen deposition (Luo et al. 2014). In contrast, most Nr
lost to the hydrosphere hardly return to circulation within China, the major exception
being 0.7 Tg N year
À1 in irrigation water returned to cropland in 2015 (up from
Fig. 5.3 Full N cycling among the 14 subsystems within China in 2015. FF fossil fuel combustion,
Ms materials, Fr fertilizer, Gs goods, PE product export, Me manure, G&S grain and straw, LP
livestock products, Aq aquaculture, UG urban green land, Wt amount of waste treated, GT garbage
treatment, WW wastewater, WT wastewater treatment. Unit, Tg N year
À1
. Flux <0.01 Tg N year
À1
was not listed
96
B. Gu and X. Zhang
livestock, and human subsystems than those subsystems have to each other. Connections among all 14 subsystems could be seen in Fig. 5.3 (more details could be
found in Gu et al. (2015)). Among these subsystems, aquaculture had relatively
small N input in total (3.7 Tg N year
À1 in 2015) but extremely rapid growth since
1980 (when inputs were only 0.2 Tg N year
À1 ). Forest and grassland represent
subsystems with relatively larger N fluxes overall (combined inputs via deposition
and NBNF of 23.6 Tg N year
À1 between them) that do not connect strongly with
human, industrial, cropping, or livestock subsystems.
Both the atmosphere and hydrosphere subsystems receive substantial and increasing quantities of Nr. For atmosphere, NH 3 plus NO x emission increased from 6.7 to
22.7 Tg N year
À1
, whereas for hydrosphere, inputs of Nr to surface and groundwater
increased from 6.1 to 24.3 Tg N year
À1 from 1980 to 2015 (Fig. 5.3), suggesting air
and water pollution in China is getting increasingly severe from uncontrolled discharge and poor limiting emissions. Through the period, NH 3 remained the most
important Nr flux to the atmosphere, although the fraction of atmospheric emissions
represented by NH 3 fluctuated between 55% and 71% from 1980 to 2015. More than
70% of the NH 3 plus NO x emitted from China was redeposited within China in 2015,
but 5.1 Tg N year
À1 left China and was deposited downwind to surrounding countries
or the Pacific Ocean, supporting the finding that there is an increasing anthropogenic
nitrogen in the North Pacific Ocean (Kim et al. 2014) and Chinese coastal seas are
facing heavy atmospheric nitrogen deposition (Luo et al. 2014). In contrast, most Nr
lost to the hydrosphere hardly return to circulation within China, the major exception
being 0.7 Tg N year
À1 in irrigation water returned to cropland in 2015 (up from
Fig. 5.3 Full N cycling among the 14 subsystems within China in 2015. FF fossil fuel combustion,
Ms materials, Fr fertilizer, Gs goods, PE product export, Me manure, G&S grain and straw, LP
livestock products, Aq aquaculture, UG urban green land, Wt amount of waste treated, GT garbage
treatment, WW wastewater, WT wastewater treatment. Unit, Tg N year
À1
. Flux <0.01 Tg N year
À1
was not listed
96
B. Gu and X. Zhang