

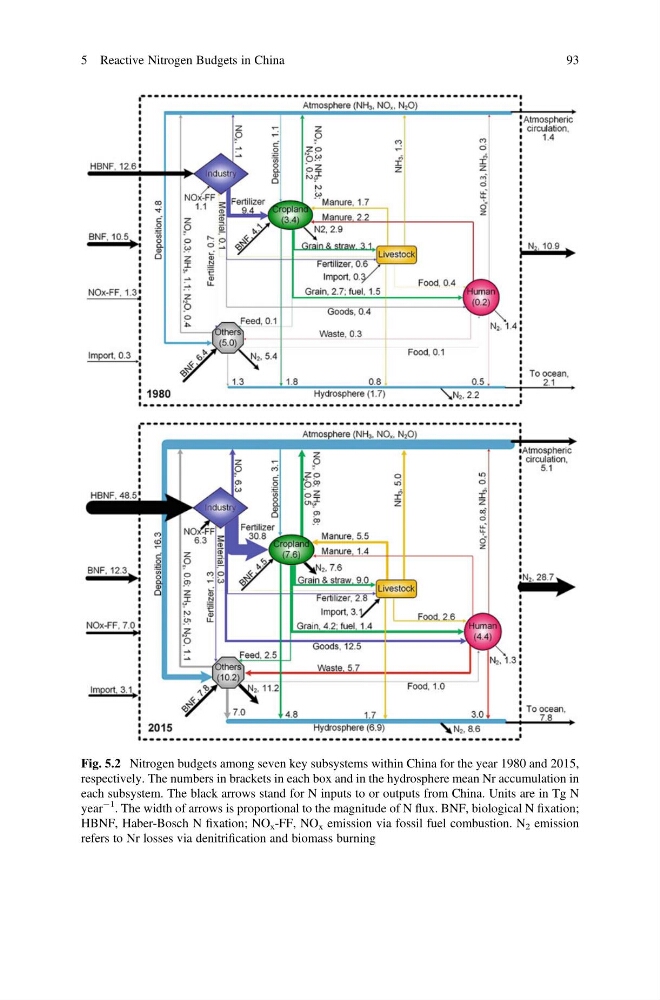
Fig. 5.2 Nitrogen budgets among seven key subsystems within China for the year 1980 and 2015,
respectively. The numbers in brackets in each box and in the hydrosphere mean Nr accumulation in
each subsystem. The black arrows stand for N inputs to or outputs from China. Units are in Tg N
year
À1
. The width of arrows is proportional to the magnitude of N flux. BNF, biological N fixation;
HBNF, Haber-Bosch N fixation; NO x -FF, NO x emission via fossil fuel combustion. N 2 emission
refers to Nr losses via denitrification and biomass burning
5 Reactive Nitrogen Budgets in China
93
respectively. The numbers in brackets in each box and in the hydrosphere mean Nr accumulation in
each subsystem. The black arrows stand for N inputs to or outputs from China. Units are in Tg N
year
À1
. The width of arrows is proportional to the magnitude of N flux. BNF, biological N fixation;
HBNF, Haber-Bosch N fixation; NO x -FF, NO x emission via fossil fuel combustion. N 2 emission
refers to Nr losses via denitrification and biomass burning
5 Reactive Nitrogen Budgets in China
93