

500
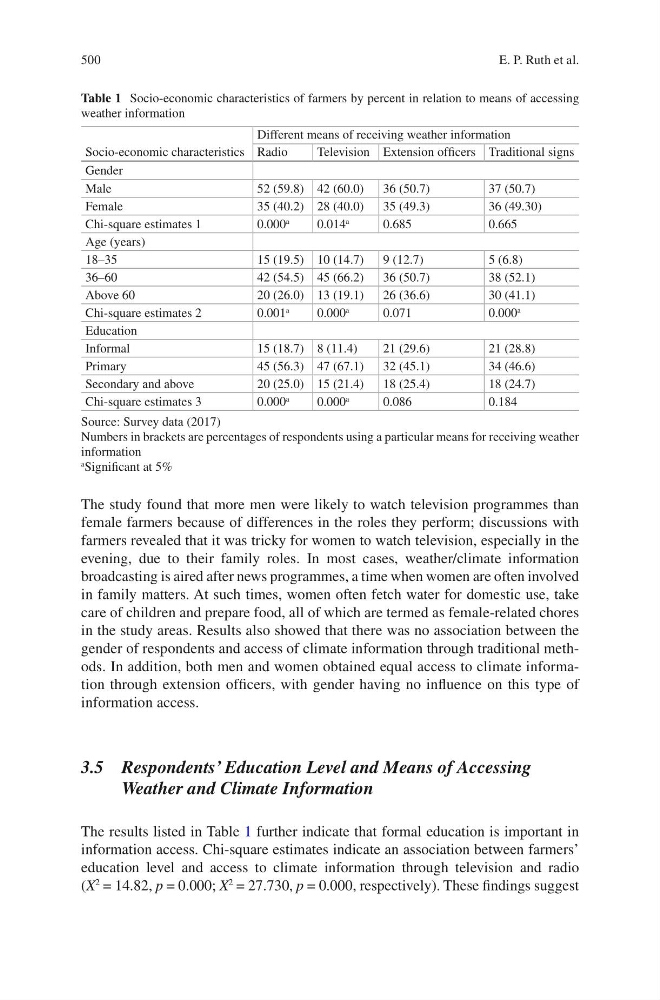
The study found that more men were likely to watch television programmes than
female farmers because of differences in the roles they perform; discussions with
farmers revealed that it was tricky for women to watch television, especially in the
evening, due to their family roles. In most cases, weather/climate information
broadcasting is aired after news programmes, a time when women are often involved
in family matters. At such times, women often fetch water for domestic use, take
care of children and prepare food, all of which are termed as female- related chores
in the study areas. Results also showed that there was no association between the
gender of respondents and access of climate information through traditional methods. In addition, both men and women obtained equal access to climate information through extension officers, with gender having no influence on this type of
information access.
3.5 Respondents’ Education Level and Means of Accessing
Weather and Climate Information
The results listed in Table 1 further indicate that formal education is important in
information access. Chi-square estimates indicate an association between farmers’
education level and access to climate information through television and radio
(X
2
= 14.82, p = 0.000; X
2
= 27.730, p = 0.000, respectively). These findings suggest
Table 1 Socio-economic characteristics of farmers by percent in relation to means of accessing
weather information
Socio-economic characteristics
Different means of receiving weather information
Radio
Television Extension officers Traditional signs
Gender
Male
52 (59.8) 42 (60.0)
36 (50.7)
37 (50.7)
Female
35 (40.2) 28 (40.0)
35 (49.3)
36 (49.30)
Chi-square estimates 1
0.000
a
0.014
a
0.685
0.665
Age (years)
18–35
15 (19.5) 10 (14.7)
9 (12.7)
5 (6.8)
36–60
42 (54.5) 45 (66.2)
36 (50.7)
38 (52.1)
Above 60
20 (26.0) 13 (19.1)
26 (36.6)
30 (41.1)
Chi-square estimates 2
0.001
a
0.000
a
0.071
0.000
a
Education
Informal
15 (18.7) 8 (11.4)
21 (29.6)
21 (28.8)
Primary
45 (56.3) 47 (67.1)
32 (45.1)
34 (46.6)
Secondary and above
20 (25.0) 15 (21.4)
18 (25.4)
18 (24.7)
Chi-square estimates 3
0.000
a
0.000
a
0.086
0.184
Source: Survey data (2017)
Numbers in brackets are percentages of respondents using a particular means for receiving weather
information
a
Significant at 5%
E. P. Ruth et al.
The study found that more men were likely to watch television programmes than
female farmers because of differences in the roles they perform; discussions with
farmers revealed that it was tricky for women to watch television, especially in the
evening, due to their family roles. In most cases, weather/climate information
broadcasting is aired after news programmes, a time when women are often involved
in family matters. At such times, women often fetch water for domestic use, take
care of children and prepare food, all of which are termed as female- related chores
in the study areas. Results also showed that there was no association between the
gender of respondents and access of climate information through traditional methods. In addition, both men and women obtained equal access to climate information through extension officers, with gender having no influence on this type of
information access.
3.5 Respondents’ Education Level and Means of Accessing
Weather and Climate Information
The results listed in Table 1 further indicate that formal education is important in
information access. Chi-square estimates indicate an association between farmers’
education level and access to climate information through television and radio
(X
2
= 14.82, p = 0.000; X
2
= 27.730, p = 0.000, respectively). These findings suggest
Table 1 Socio-economic characteristics of farmers by percent in relation to means of accessing
weather information
Socio-economic characteristics
Different means of receiving weather information
Radio
Television Extension officers Traditional signs
Gender
Male
52 (59.8) 42 (60.0)
36 (50.7)
37 (50.7)
Female
35 (40.2) 28 (40.0)
35 (49.3)
36 (49.30)
Chi-square estimates 1
0.000
a
0.014
a
0.685
0.665
Age (years)
18–35
15 (19.5) 10 (14.7)
9 (12.7)
5 (6.8)
36–60
42 (54.5) 45 (66.2)
36 (50.7)
38 (52.1)
Above 60
20 (26.0) 13 (19.1)
26 (36.6)
30 (41.1)
Chi-square estimates 2
0.001
a
0.000
a
0.071
0.000
a
Education
Informal
15 (18.7) 8 (11.4)
21 (29.6)
21 (28.8)
Primary
45 (56.3) 47 (67.1)
32 (45.1)
34 (46.6)
Secondary and above
20 (25.0) 15 (21.4)
18 (25.4)
18 (24.7)
Chi-square estimates 3
0.000
a
0.000
a
0.086
0.184
Source: Survey data (2017)
Numbers in brackets are percentages of respondents using a particular means for receiving weather
information
a
Significant at 5%
E. P. Ruth et al.