

272
its chemical composition. The gross milk composition varies within species (due to
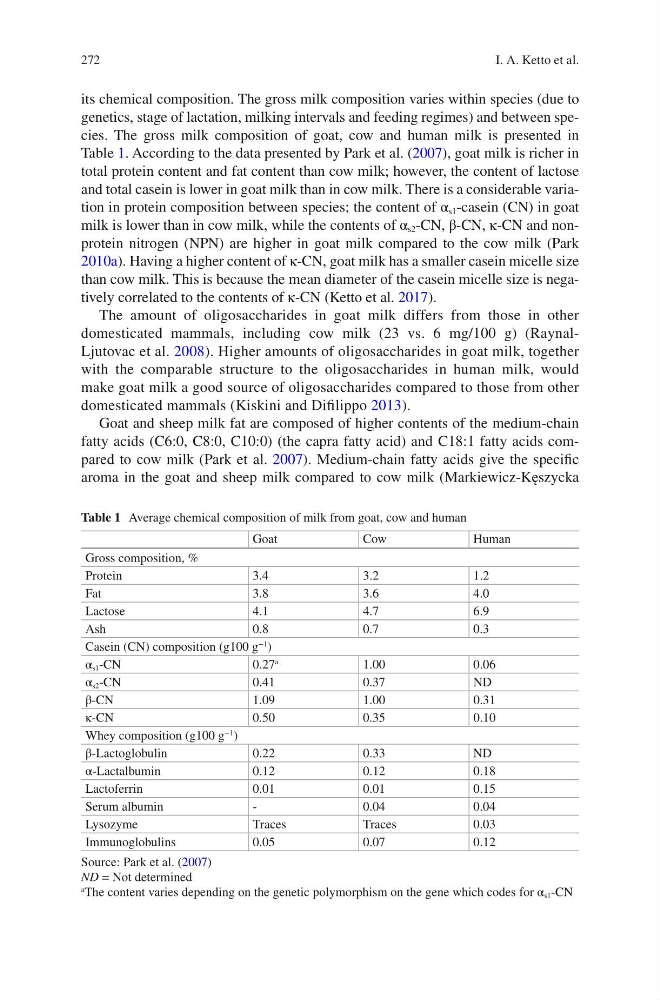
genetics, stage of lactation, milking intervals and feeding regimes) and between species. The gross milk composition of goat, cow and human milk is presented in
Table 1. According to the data presented by Park et al. (2007), goat milk is richer in
total protein content and fat content than cow milk; however, the content of lactose
and total casein is lower in goat milk than in cow milk. There is a considerable variation in protein composition between species; the content of α s1 -casein (CN) in goat
milk is lower than in cow milk, while the contents of α s2 -CN, β-CN, κ-CN and nonprotein nitrogen (NPN) are higher in goat milk compared to the cow milk (Park
2010a). Having a higher content of κ-CN, goat milk has a smaller casein micelle size
than cow milk. This is because the mean diameter of the casein micelle size is negatively correlated to the contents of κ-CN (Ketto et al. 2017).
The amount of oligosaccharides in goat milk differs from those in other
domesticated mammals, including cow milk (23 vs. 6 mg/100 g) (RaynalLjutovac et al. 2008). Higher amounts of oligosaccharides in goat milk, together
with the comparable structure to the oligosaccharides in human milk, would
make goat milk a good source of oligosaccharides compared to those from other
domesticated mammals (Kiskini and Difilippo 2013).
Goat and sheep milk fat are composed of higher contents of the medium-chain
fatty acids (C6:0, C8:0, C10:0) (the capra fatty acid) and C18:1 fatty acids compared to cow milk (Park et al. 2007). Medium-chain fatty acids give the specific
aroma in the goat and sheep milk compared to cow milk (Markiewicz-Kęszycka
Table 1 Average chemical composition of milk from goat, cow and human
Goat
Cow
Human
Gross composition, %
Protein
3.4
3.2
1.2
Fat
3.8
3.6
4.0
Lactose
4.1
4.7
6.9
Ash
0.8
0.7
0.3
Casein (CN) composition (g100 g
−1 )
α s1 -CN
0.27
a
1.00
0.06
α s2 -CN
0.41
0.37
ND
β-CN
1.09
1.00
0.31
κ-CN
0.50
0.35
0.10
Whey composition (g100 g
−1 )
β-Lactoglobulin
0.22
0.33
ND
α-Lactalbumin
0.12
0.12
0.18
Lactoferrin
0.01
0.01
0.15
Serum albumin
-
0.04
0.04
Lysozyme
Traces
Traces
0.03
Immunoglobulins
0.05
0.07
0.12
Source: Park et al. (2007)
ND = Not determined
a
The content varies depending on the genetic polymorphism on the gene which codes for α s1 -CN
I. A. Ketto et al.
its chemical composition. The gross milk composition varies within species (due to
genetics, stage of lactation, milking intervals and feeding regimes) and between species. The gross milk composition of goat, cow and human milk is presented in
Table 1. According to the data presented by Park et al. (2007), goat milk is richer in
total protein content and fat content than cow milk; however, the content of lactose
and total casein is lower in goat milk than in cow milk. There is a considerable variation in protein composition between species; the content of α s1 -casein (CN) in goat
milk is lower than in cow milk, while the contents of α s2 -CN, β-CN, κ-CN and nonprotein nitrogen (NPN) are higher in goat milk compared to the cow milk (Park
2010a). Having a higher content of κ-CN, goat milk has a smaller casein micelle size
than cow milk. This is because the mean diameter of the casein micelle size is negatively correlated to the contents of κ-CN (Ketto et al. 2017).
The amount of oligosaccharides in goat milk differs from those in other
domesticated mammals, including cow milk (23 vs. 6 mg/100 g) (RaynalLjutovac et al. 2008). Higher amounts of oligosaccharides in goat milk, together
with the comparable structure to the oligosaccharides in human milk, would
make goat milk a good source of oligosaccharides compared to those from other
domesticated mammals (Kiskini and Difilippo 2013).
Goat and sheep milk fat are composed of higher contents of the medium-chain
fatty acids (C6:0, C8:0, C10:0) (the capra fatty acid) and C18:1 fatty acids compared to cow milk (Park et al. 2007). Medium-chain fatty acids give the specific
aroma in the goat and sheep milk compared to cow milk (Markiewicz-Kęszycka
Table 1 Average chemical composition of milk from goat, cow and human
Goat
Cow
Human
Gross composition, %
Protein
3.4
3.2
1.2
Fat
3.8
3.6
4.0
Lactose
4.1
4.7
6.9
Ash
0.8
0.7
0.3
Casein (CN) composition (g100 g
−1 )
α s1 -CN
0.27
a
1.00
0.06
α s2 -CN
0.41
0.37
ND
β-CN
1.09
1.00
0.31
κ-CN
0.50
0.35
0.10
Whey composition (g100 g
−1 )
β-Lactoglobulin
0.22
0.33
ND
α-Lactalbumin
0.12
0.12
0.18
Lactoferrin
0.01
0.01
0.15
Serum albumin
-
0.04
0.04
Lysozyme
Traces
Traces
0.03
Immunoglobulins
0.05
0.07
0.12
Source: Park et al. (2007)
ND = Not determined
a
The content varies depending on the genetic polymorphism on the gene which codes for α s1 -CN
I. A. Ketto et al.