

208
3.4 Effect of Different Pearl Millet Inclusion Levels on Feed
Digestibility
Digestibility results showed that the diet with pearl millet as the sole energy source
has significantly (P < 0.001) lower digestibility (64.73%) than the rest of the other
treatments which were similar (0% pearl millet = 82.34%; 10% pearl millet = 81.83%; and 20% pearl millet = 81.5%). In general, digestibility tended to
reduce with increasing inclusion levels of pearl millet.
3.5 Effect of Pearl Millet on Productivity Cost
1
Taking variable costs into consideration, the average cost per broiler was MK1492.5
($2.06), MK1512.20 ($2.09), MK1531.90 ($2.11), and MK1619.70 ($2.23) for
treatments 1, 2, 3, and 4, respectively. Cost per broiler tended to increase with
increasing levels of pearl millet used. Using an average selling price of MK2800
($3.86) per whole carcass as farm gate price, the results show that the sole maizebased diet (T1) had the highest gross margin.
1 1 US $ = MK725
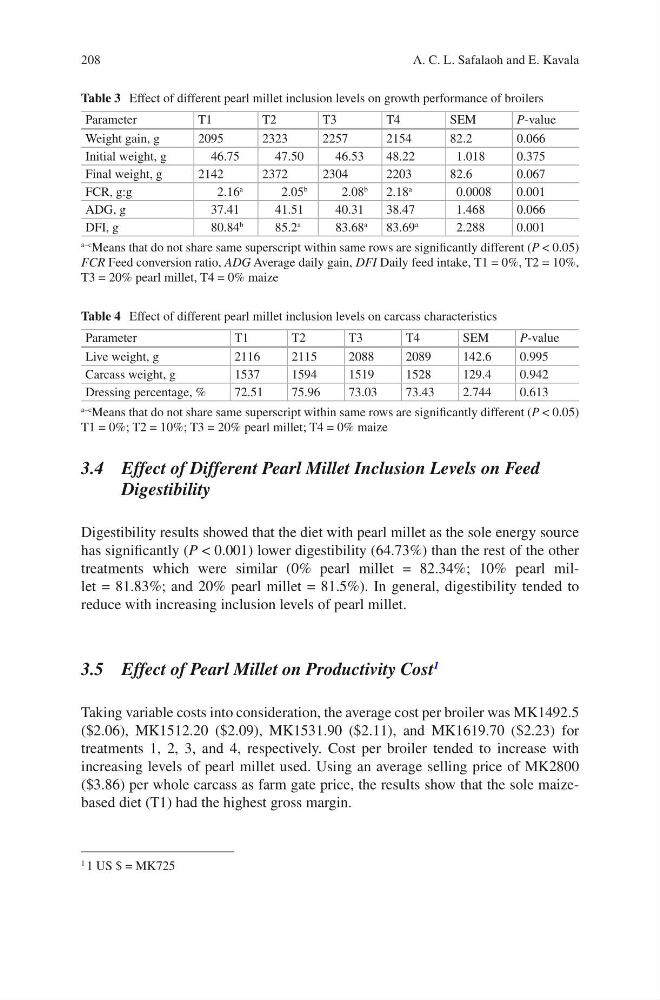
Table 3 Effect of different pearl millet inclusion levels on growth performance of broilers
Parameter
T1
T2
T3
T4
SEM
P-value
Weight gain, g
2095
2323
2257
2154
82.2
0.066
Initial weight, g
46.75
47.50
46.53
48.22
1.018
0.375
Final weight, g
2142
2372
2304
2203
82.6
0.067
FCR, g:g
2.16
a
2.05
b
2.08
b
2.18
a
0.0008
0.001
ADG, g
37.41
41.51
40.31
38.47
1.468
0.066
DFI, g
80.84
b
85.2
a
83.68
a
83.69
a
2.288
0.001
a–c
Means that do not share same superscript within same rows are significantly different (P < 0.05)
FCR Feed conversion ratio, ADG Average daily gain, DFI Daily feed intake, T1 = 0%, T2 = 10%,
T3 = 20% pearl millet, T4 = 0% maize
Table 4 Effect of different pearl millet inclusion levels on carcass characteristics
Parameter
T1
T2
T3
T4
SEM
P-value
Live weight, g
2116
2115
2088
2089
142.6
0.995
Carcass weight, g
1537
1594
1519
1528
129.4
0.942
Dressing percentage, %
72.51
75.96
73.03
73.43
2.744
0.613
a–c
Means that do not share same superscript within same rows are significantly different (P < 0.05)
T1 = 0%; T2 = 10%; T3 = 20% pearl millet; T4 = 0% maize
A. C. L. Safalaoh and E. Kavala
3.4 Effect of Different Pearl Millet Inclusion Levels on Feed
Digestibility
Digestibility results showed that the diet with pearl millet as the sole energy source
has significantly (P < 0.001) lower digestibility (64.73%) than the rest of the other
treatments which were similar (0% pearl millet = 82.34%; 10% pearl millet = 81.83%; and 20% pearl millet = 81.5%). In general, digestibility tended to
reduce with increasing inclusion levels of pearl millet.
3.5 Effect of Pearl Millet on Productivity Cost
1
Taking variable costs into consideration, the average cost per broiler was MK1492.5
($2.06), MK1512.20 ($2.09), MK1531.90 ($2.11), and MK1619.70 ($2.23) for
treatments 1, 2, 3, and 4, respectively. Cost per broiler tended to increase with
increasing levels of pearl millet used. Using an average selling price of MK2800
($3.86) per whole carcass as farm gate price, the results show that the sole maizebased diet (T1) had the highest gross margin.
1 1 US $ = MK725
Table 3 Effect of different pearl millet inclusion levels on growth performance of broilers
Parameter
T1
T2
T3
T4
SEM
P-value
Weight gain, g
2095
2323
2257
2154
82.2
0.066
Initial weight, g
46.75
47.50
46.53
48.22
1.018
0.375
Final weight, g
2142
2372
2304
2203
82.6
0.067
FCR, g:g
2.16
a
2.05
b
2.08
b
2.18
a
0.0008
0.001
ADG, g
37.41
41.51
40.31
38.47
1.468
0.066
DFI, g
80.84
b
85.2
a
83.68
a
83.69
a
2.288
0.001
a–c
Means that do not share same superscript within same rows are significantly different (P < 0.05)
FCR Feed conversion ratio, ADG Average daily gain, DFI Daily feed intake, T1 = 0%, T2 = 10%,
T3 = 20% pearl millet, T4 = 0% maize
Table 4 Effect of different pearl millet inclusion levels on carcass characteristics
Parameter
T1
T2
T3
T4
SEM
P-value
Live weight, g
2116
2115
2088
2089
142.6
0.995
Carcass weight, g
1537
1594
1519
1528
129.4
0.942
Dressing percentage, %
72.51
75.96
73.03
73.43
2.744
0.613
a–c
Means that do not share same superscript within same rows are significantly different (P < 0.05)
T1 = 0%; T2 = 10%; T3 = 20% pearl millet; T4 = 0% maize
A. C. L. Safalaoh and E. Kavala