

108
Similarly, Partey et al. (2014) reported an increase in mineralization rate of 58%
and 55% by mixing maize residues with Vicia faba and Tithonia diversifolia, respectively. Furthermore, significant increases in microbial biomass were also reported
with V. faba and T. diversifolia alone or in combination with maize residues (Partey
et al. 2014). On the other hand, Sakala et al. (2000) reported increased N mineralization with additional amounts of high-quality PP residues and N fertilizer to maize
residues. It should be noted that the previously Sole MZ + 92 N plots showed relatively higher amounts of mineral N than that of previously Sole MZ plots. This can
be attributed to the slightly higher quality of the residues as well as residual N from
the previously applied urea; however, the highest levels were only more conspicuous at the start of the rains, and thereafter they dropped. This implies that the already
readily available N from the previous season was leached quickly by the rains.
Beauchamp (1987) reported residual benefits of urea on maize in a season immediately after the season in which urea was applied.
The maize grain yields determined in this study were in similar ranges as maize
yields reported by Zingore (2011) for medium to highly fertile soils of Malawi and
by Tamene et al. (2015) for farmers practising good management practices such as
integration of NPK fertilizers and animal manure, which are relatively higher than
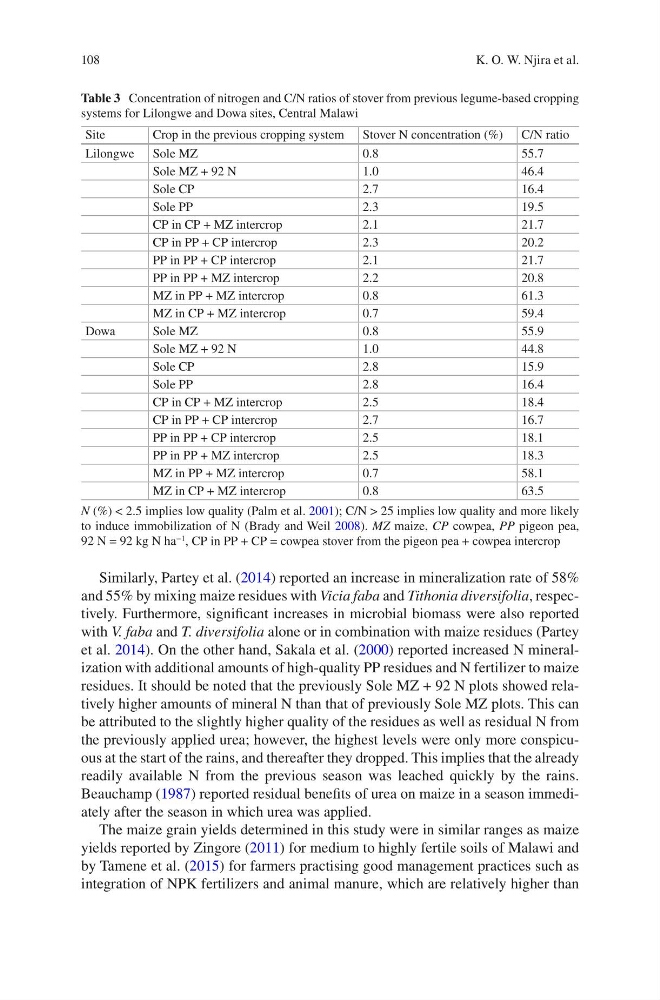
Table 3 Concentration of nitrogen and C/N ratios of stover from previous legume-based cropping
systems for Lilongwe and Dowa sites, Central Malawi
Site
Crop in the previous cropping system Stover N concentration (%) C/N ratio
Lilongwe Sole MZ
0.8
55.7
Sole MZ + 92 N
1.0
46.4
Sole CP
2.7
16.4
Sole PP
2.3
19.5
CP in CP + MZ intercrop
2.1
21.7
CP in PP + CP intercrop
2.3
20.2
PP in PP + CP intercrop
2.1
21.7
PP in PP + MZ intercrop
2.2
20.8
MZ in PP + MZ intercrop
0.8
61.3
MZ in CP + MZ intercrop
0.7
59.4
Dowa
Sole MZ
0.8
55.9
Sole MZ + 92 N
1.0
44.8
Sole CP
2.8
15.9
Sole PP
2.8
16.4
CP in CP + MZ intercrop
2.5
18.4
CP in PP + CP intercrop
2.7
16.7
PP in PP + CP intercrop
2.5
18.1
PP in PP + MZ intercrop
2.5
18.3
MZ in PP + MZ intercrop
0.7
58.1
MZ in CP + MZ intercrop
0.8
63.5
N (%) < 2.5 implies low quality (Palm et al. 2001); C/N > 25 implies low quality and more likely
to induce immobilization of N (Brady and Weil 2008). MZ maize, CP cowpea, PP pigeon pea,
92 N = 92 kg N ha
−1 , CP in PP + CP = cowpea stover from the pigeon pea + cowpea intercrop
K. O. W. Njira et al.
Similarly, Partey et al. (2014) reported an increase in mineralization rate of 58%
and 55% by mixing maize residues with Vicia faba and Tithonia diversifolia, respectively. Furthermore, significant increases in microbial biomass were also reported
with V. faba and T. diversifolia alone or in combination with maize residues (Partey
et al. 2014). On the other hand, Sakala et al. (2000) reported increased N mineralization with additional amounts of high-quality PP residues and N fertilizer to maize
residues. It should be noted that the previously Sole MZ + 92 N plots showed relatively higher amounts of mineral N than that of previously Sole MZ plots. This can
be attributed to the slightly higher quality of the residues as well as residual N from
the previously applied urea; however, the highest levels were only more conspicuous at the start of the rains, and thereafter they dropped. This implies that the already
readily available N from the previous season was leached quickly by the rains.
Beauchamp (1987) reported residual benefits of urea on maize in a season immediately after the season in which urea was applied.
The maize grain yields determined in this study were in similar ranges as maize
yields reported by Zingore (2011) for medium to highly fertile soils of Malawi and
by Tamene et al. (2015) for farmers practising good management practices such as
integration of NPK fertilizers and animal manure, which are relatively higher than
Table 3 Concentration of nitrogen and C/N ratios of stover from previous legume-based cropping
systems for Lilongwe and Dowa sites, Central Malawi
Site
Crop in the previous cropping system Stover N concentration (%) C/N ratio
Lilongwe Sole MZ
0.8
55.7
Sole MZ + 92 N
1.0
46.4
Sole CP
2.7
16.4
Sole PP
2.3
19.5
CP in CP + MZ intercrop
2.1
21.7
CP in PP + CP intercrop
2.3
20.2
PP in PP + CP intercrop
2.1
21.7
PP in PP + MZ intercrop
2.2
20.8
MZ in PP + MZ intercrop
0.8
61.3
MZ in CP + MZ intercrop
0.7
59.4
Dowa
Sole MZ
0.8
55.9
Sole MZ + 92 N
1.0
44.8
Sole CP
2.8
15.9
Sole PP
2.8
16.4
CP in CP + MZ intercrop
2.5
18.4
CP in PP + CP intercrop
2.7
16.7
PP in PP + CP intercrop
2.5
18.1
PP in PP + MZ intercrop
2.5
18.3
MZ in PP + MZ intercrop
0.7
58.1
MZ in CP + MZ intercrop
0.8
63.5
N (%) < 2.5 implies low quality (Palm et al. 2001); C/N > 25 implies low quality and more likely
to induce immobilization of N (Brady and Weil 2008). MZ maize, CP cowpea, PP pigeon pea,
92 N = 92 kg N ha
−1 , CP in PP + CP = cowpea stover from the pigeon pea + cowpea intercrop
K. O. W. Njira et al.