

101
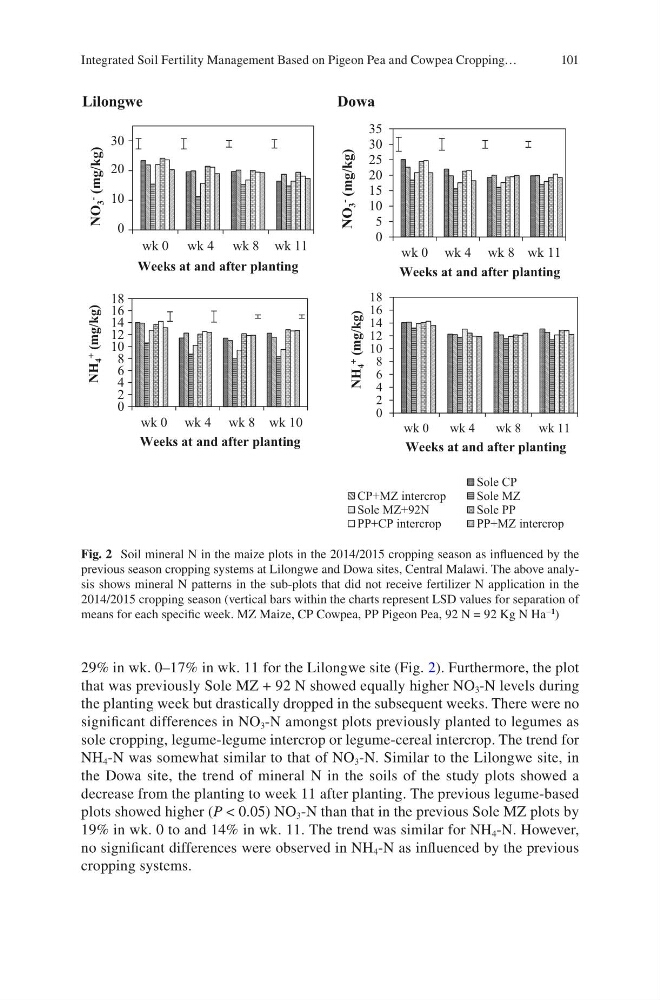
29% in wk. 0–17% in wk. 11 for the Lilongwe site (Fig. 2). Furthermore, the plot
that was previously Sole MZ + 92 N showed equally higher NO 3 -N levels during
the planting week but drastically dropped in the subsequent weeks. There were no
significant differences in NO 3 -N amongst plots previously planted to legumes as
sole cropping, legume-legume intercrop or legume-cereal intercrop. The trend for
NH 4 -N was somewhat similar to that of NO 3 -N. Similar to the Lilongwe site, in
the Dowa site, the trend of mineral N in the soils of the study plots showed a
decrease from the planting to week 11 after planting. The previous legume-based
plots showed higher (P < 0.05) NO 3 -N than that in the previous Sole MZ plots by
19% in wk. 0 to and 14% in wk. 11. The trend was similar for NH 4 -N. However,
no significant differences were observed in NH 4 -N as influenced by the previous
cropping systems.
Lilongwe
Dowa
0
10
20
30
wk 0 wk 4 wk 8 wk 11
NO
3
-
(mg/kg)
Weeks at and after planting
0
5
10
15
20
25
30
35
wk 0 wk 4 wk 8 wk 11
NO
3
-
(mg/kg)
Weeks at and after planting
0
2
4
6
8
10
12
14
16
18
wk 0 wk 4 wk 8 wk 10
NH
4
+
(mg/kg)
Weeks at and after planting
0
2
4
6
8
10
12
14
16
18
wk 0
wk 4
wk 8 wk 11
NH
4
+
(mg/kg)
Weeks at and after planting
Sole CP
CP+MZ intercrop
Sole MZ
Sole MZ+92N
Sole PP
PP+CP intercrop
PP+MZ intercrop
Fig. 2 Soil mineral N in the maize plots in the 2014/2015 cropping season as influenced by the
previous season cropping systems at Lilongwe and Dowa sites, Central Malawi. The above analysis shows mineral N patterns in the sub-plots that did not receive fertilizer N application in the
2014/2015 cropping season (vertical bars within the charts represent LSD values for separation of
means for each specific week. MZ Maize, CP Cowpea, PP Pigeon Pea, 92 N = 92 Kg N Ha
−1
)
Integrated Soil Fertility Management Based on Pigeon Pea and Cowpea Cropping…
29% in wk. 0–17% in wk. 11 for the Lilongwe site (Fig. 2). Furthermore, the plot
that was previously Sole MZ + 92 N showed equally higher NO 3 -N levels during
the planting week but drastically dropped in the subsequent weeks. There were no
significant differences in NO 3 -N amongst plots previously planted to legumes as
sole cropping, legume-legume intercrop or legume-cereal intercrop. The trend for
NH 4 -N was somewhat similar to that of NO 3 -N. Similar to the Lilongwe site, in
the Dowa site, the trend of mineral N in the soils of the study plots showed a
decrease from the planting to week 11 after planting. The previous legume-based
plots showed higher (P < 0.05) NO 3 -N than that in the previous Sole MZ plots by
19% in wk. 0 to and 14% in wk. 11. The trend was similar for NH 4 -N. However,
no significant differences were observed in NH 4 -N as influenced by the previous
cropping systems.
Lilongwe
Dowa
0
10
20
30
wk 0 wk 4 wk 8 wk 11
NO
3
-
(mg/kg)
Weeks at and after planting
0
5
10
15
20
25
30
35
wk 0 wk 4 wk 8 wk 11
NO
3
-
(mg/kg)
Weeks at and after planting
0
2
4
6
8
10
12
14
16
18
wk 0 wk 4 wk 8 wk 10
NH
4
+
(mg/kg)
Weeks at and after planting
0
2
4
6
8
10
12
14
16
18
wk 0
wk 4
wk 8 wk 11
NH
4
+
(mg/kg)
Weeks at and after planting
Sole CP
CP+MZ intercrop
Sole MZ
Sole MZ+92N
Sole PP
PP+CP intercrop
PP+MZ intercrop
Fig. 2 Soil mineral N in the maize plots in the 2014/2015 cropping season as influenced by the
previous season cropping systems at Lilongwe and Dowa sites, Central Malawi. The above analysis shows mineral N patterns in the sub-plots that did not receive fertilizer N application in the
2014/2015 cropping season (vertical bars within the charts represent LSD values for separation of
means for each specific week. MZ Maize, CP Cowpea, PP Pigeon Pea, 92 N = 92 Kg N Ha
−1
)
Integrated Soil Fertility Management Based on Pigeon Pea and Cowpea Cropping…