

40
8. At sampling time, remove dialysis device and collect sample
from conical tube.
9. Analyze the amount of interested molecule permeating through
membrane with an appropriate analysis method.
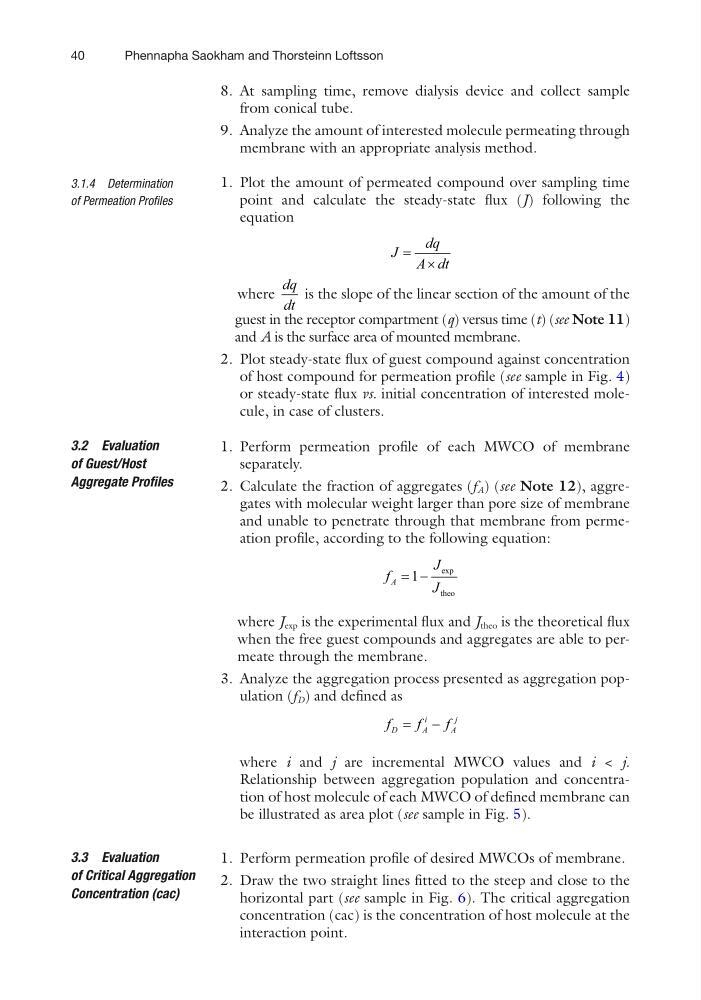
1. Plot the amount of permeated compound over sampling time
point and calculate the steady-state flux (J) following the
equation
J
dq
A dt
= ×
where
dq
dt
is the slope of the linear section of the amount of the
guest in the receptor compartment (q) versus time (t) (see Note 11)
and A is the surface area of mounted membrane.
2. Plot steady-state flux of guest compound against concentration
of host compound for permeation profile (see sample in Fig. 4)
or steady-state flux vs. initial concentration of interested molecule, in case of clusters.
1. Perform permeation profile of each MWCO of membrane
separately.
2. Calculate the fraction of aggregates (f A ) (see Note 12), aggregates with molecular weight larger than pore size of membrane
and unable to penetrate through that membrane from permeation profile, according to the following equation:
f
J
J
A = −
1
exp
theo
where J exp is the experimental flux and J theo is the theoretical flux
when the free guest compounds and aggregates are able to permeate through the membrane.
3. Analyze the aggregation process presented as aggregation population (f D ) and defined as
f
f
f
D
A
i
A
j
= −
where i and j are incremental MWCO values and i < j.
Relationship between aggregation population and concentration of host molecule of each MWCO of defined membrane can
be illustrated as area plot (see sample in Fig. 5).
1. Perform permeation profile of desired MWCOs of membrane.
2. Draw the two straight lines fitted to the steep and close to the
horizontal part (see sample in Fig. 6). The critical aggregation
concentration (cac) is the concentration of host molecule at the
interaction point.
3.1.4 Determination
of Permeation Profiles
3.2 Evaluation
of Guest/Host
Aggregate Profiles
3.3 Evaluation
of Critical Aggregation
Concentration (cac)
Phennapha Saokham and Thorsteinn Loftsson
8. At sampling time, remove dialysis device and collect sample
from conical tube.
9. Analyze the amount of interested molecule permeating through
membrane with an appropriate analysis method.
1. Plot the amount of permeated compound over sampling time
point and calculate the steady-state flux (J) following the
equation
J
dq
A dt
= ×
where
dq
dt
is the slope of the linear section of the amount of the
guest in the receptor compartment (q) versus time (t) (see Note 11)
and A is the surface area of mounted membrane.
2. Plot steady-state flux of guest compound against concentration
of host compound for permeation profile (see sample in Fig. 4)
or steady-state flux vs. initial concentration of interested molecule, in case of clusters.
1. Perform permeation profile of each MWCO of membrane
separately.
2. Calculate the fraction of aggregates (f A ) (see Note 12), aggregates with molecular weight larger than pore size of membrane
and unable to penetrate through that membrane from permeation profile, according to the following equation:
f
J
J
A = −
1
exp
theo
where J exp is the experimental flux and J theo is the theoretical flux
when the free guest compounds and aggregates are able to permeate through the membrane.
3. Analyze the aggregation process presented as aggregation population (f D ) and defined as
f
f
f
D
A
i
A
j
= −
where i and j are incremental MWCO values and i < j.
Relationship between aggregation population and concentration of host molecule of each MWCO of defined membrane can
be illustrated as area plot (see sample in Fig. 5).
1. Perform permeation profile of desired MWCOs of membrane.
2. Draw the two straight lines fitted to the steep and close to the
horizontal part (see sample in Fig. 6). The critical aggregation
concentration (cac) is the concentration of host molecule at the
interaction point.
3.1.4 Determination
of Permeation Profiles
3.2 Evaluation
of Guest/Host
Aggregate Profiles
3.3 Evaluation
of Critical Aggregation
Concentration (cac)
Phennapha Saokham and Thorsteinn Loftsson