

244
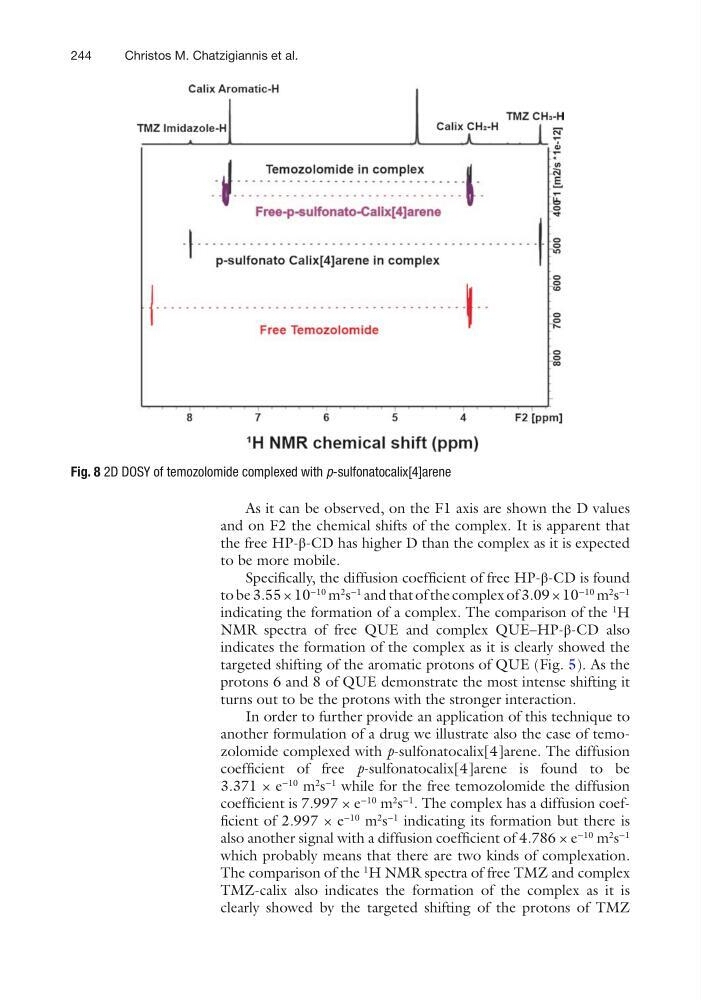
As it can be observed, on the F1 axis are shown the D values
and on F2 the chemical shifts of the complex. It is apparent that
the free HP-β-CD has higher D than the complex as it is expected
to be more mobile.
Specifically, the diffusion coefficient of free HP-β-CD is found
to be 3.55 × 10
−10
m
2
s
−1
and that of the complex of 3.09 × 10
−10
m
2
s
−1
indicating the formation of a complex. The comparison of the
1
H
NMR spectra of free QUE and complex QUE–HP-β-CD also
indicates the formation of the complex as it is clearly showed the
targeted shifting of the aromatic protons of QUE (Fig. 5). As the
protons 6 and 8 of QUE demonstrate the most intense shifting it
turns out to be the protons with the stronger interaction.
In order to further provide an application of this technique to
another formulation of a drug we illustrate also the case of temozolomide complexed with p-sulfonatocalix[4]arene. The diffusion
coefficient of free p-sulfonatocalix[4]arene is found to be
3.371 × e
−10
m
2
s
−1
while for the free temozolomide the diffusion
coefficient is 7.997 × e
−10
m
2
s
−1
. The complex has a diffusion coefficient of 2.997 × e
−10
m
2
s
−1
indicating its formation but there is
also another signal with a diffusion coefficient of 4.786 × e
−10
m
2
s
−1
which probably means that there are two kinds of complexation.
The comparison of the
1
H NMR spectra of free TMZ and complex
TMZ-calix also indicates the formation of the complex as it is
clearly showed by the targeted shifting of the protons of TMZ
Fig. 8 2D DOSY of temozolomide complexed with p-sulfonatocalix[4]arene
Christos M. Chatzigiannis et al.
As it can be observed, on the F1 axis are shown the D values
and on F2 the chemical shifts of the complex. It is apparent that
the free HP-β-CD has higher D than the complex as it is expected
to be more mobile.
Specifically, the diffusion coefficient of free HP-β-CD is found
to be 3.55 × 10
−10
m
2
s
−1
and that of the complex of 3.09 × 10
−10
m
2
s
−1
indicating the formation of a complex. The comparison of the
1
H
NMR spectra of free QUE and complex QUE–HP-β-CD also
indicates the formation of the complex as it is clearly showed the
targeted shifting of the aromatic protons of QUE (Fig. 5). As the
protons 6 and 8 of QUE demonstrate the most intense shifting it
turns out to be the protons with the stronger interaction.
In order to further provide an application of this technique to
another formulation of a drug we illustrate also the case of temozolomide complexed with p-sulfonatocalix[4]arene. The diffusion
coefficient of free p-sulfonatocalix[4]arene is found to be
3.371 × e
−10
m
2
s
−1
while for the free temozolomide the diffusion
coefficient is 7.997 × e
−10
m
2
s
−1
. The complex has a diffusion coefficient of 2.997 × e
−10
m
2
s
−1
indicating its formation but there is
also another signal with a diffusion coefficient of 4.786 × e
−10
m
2
s
−1
which probably means that there are two kinds of complexation.
The comparison of the
1
H NMR spectra of free TMZ and complex
TMZ-calix also indicates the formation of the complex as it is
clearly showed by the targeted shifting of the protons of TMZ
Fig. 8 2D DOSY of temozolomide complexed with p-sulfonatocalix[4]arene
Christos M. Chatzigiannis et al.