

242
7. Measure T1 of your sample. The relaxation delay should be
5×T1 with respect to the largest relaxation measurement. T1
values are calculated from 2 to 3.5 s after they have been determined by the inversion recovery time pulse.
8. Spin your sample (see Note 5).
The second step is the establishment of the intensities of the second spectrum that are only 2–5% relative to the first one. The steps
to achieve this are the following:
1. Run the first spectrum with gpz6 = 2 and the second with
gpz6 = 95. This means that the intensity of the peaks on the
second spectrum is only 5% relative to the first one. The magnetization falls according to Fig. 6.
2. Check the ratio of the intensities of the two spectra. If it is not
proper it means that the above curve is not followed and decays
with either slower or faster fashion (Fig. 6).
3. If you are not achieving the proper ratio, change p30 and d20
parameters accordingly until you achieve it. Start first with p30
and then with d20. The range of values you can have to achieve
your aim is as follows:
d20 ≤ 2500 ms
p30 ≤ 5 ms
4. Collect 16 BPPLED spectra with 16 K data and set the eddy
current delay (Te) to 5 ms. A 2D DOSY for the quercetin complex with HP-β-CD is shown in Fig. 7 and a 2D DOSY for the
temozolomide calix[4]arene is shown in Fig. 8 (see Note 6).
3.2.2 2D DOSY NMR
Spectrum
Free Quercetin
Quercetin-Hp-β-CD
Hp-β-CD H
HO
OH
O
OH
OH
OH
7
6
5
10
8
9
0
4
3
3'
4'
5'
6'
2
2'
1'
2 H
6'H
5'H
8H
6tH
7.5
6.9
6.3
5.7
'H NMR chemical shift (ppm)
'
A
Temozolomide-p-sulfonato-Calixarene
complex
TMZ Imidazole-H
Calix Aromatic-H
Calix CH2-H
TMZ CH3-H
Temozolomide(TMZ)
Imidazole-H
Temerolomide
N
O
O
N
N
N
N
NH3
p-sulfonato-Calixarene
(Calix)
Aromatic - H
HO3S SO3H
SO3H
SO3H
OH
OH OH
OH
p-Sulfomato-Colix[4]arene
CH 3 -H
CH 2 -H
'H NMR chemical shift (ppm)
8
6
4
[PPM]
5.1
B
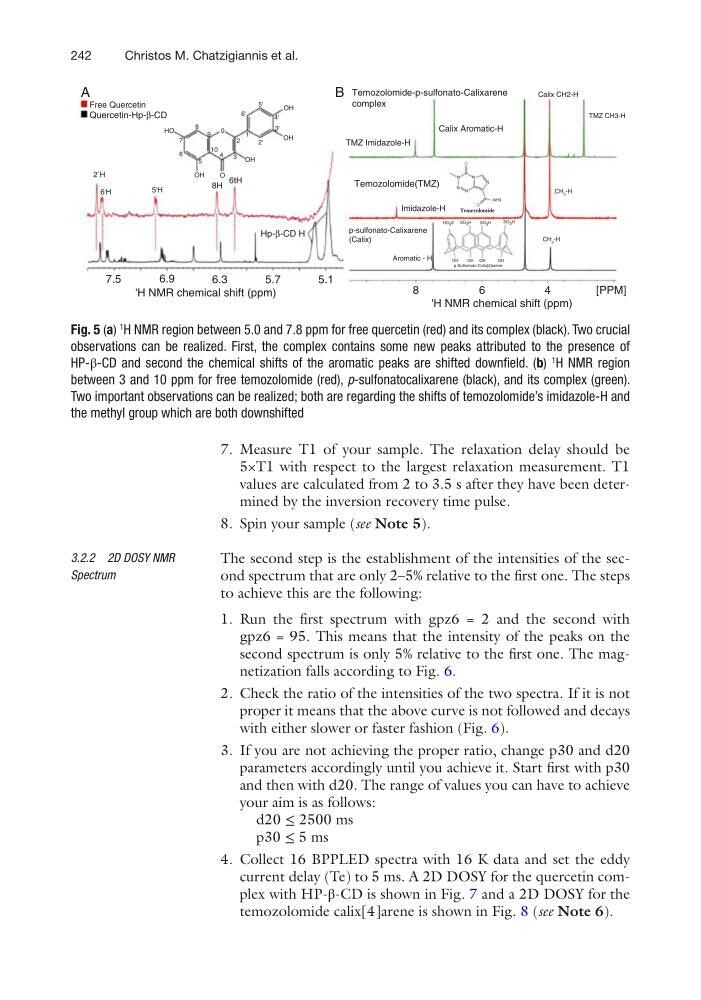
Fig. 5 (a)
1
H NMR region between 5.0 and 7.8 ppm for free quercetin (red) and its complex (black). Two crucial
observations can be realized. First, the complex contains some new peaks attributed to the presence of
HP-β-CD and second the chemical shifts of the aromatic peaks are shifted downfield. (b)
1
H NMR region
between 3 and 10 ppm for free temozolomide (red), p-sulfonatocalixarene (black), and its complex (green).
Two important observations can be realized; both are regarding the shifts of temozolomide’s imidazole-H and
the methyl group which are both downshifted
Christos M. Chatzigiannis et al.
7. Measure T1 of your sample. The relaxation delay should be
5×T1 with respect to the largest relaxation measurement. T1
values are calculated from 2 to 3.5 s after they have been determined by the inversion recovery time pulse.
8. Spin your sample (see Note 5).
The second step is the establishment of the intensities of the second spectrum that are only 2–5% relative to the first one. The steps
to achieve this are the following:
1. Run the first spectrum with gpz6 = 2 and the second with
gpz6 = 95. This means that the intensity of the peaks on the
second spectrum is only 5% relative to the first one. The magnetization falls according to Fig. 6.
2. Check the ratio of the intensities of the two spectra. If it is not
proper it means that the above curve is not followed and decays
with either slower or faster fashion (Fig. 6).
3. If you are not achieving the proper ratio, change p30 and d20
parameters accordingly until you achieve it. Start first with p30
and then with d20. The range of values you can have to achieve
your aim is as follows:
d20 ≤ 2500 ms
p30 ≤ 5 ms
4. Collect 16 BPPLED spectra with 16 K data and set the eddy
current delay (Te) to 5 ms. A 2D DOSY for the quercetin complex with HP-β-CD is shown in Fig. 7 and a 2D DOSY for the
temozolomide calix[4]arene is shown in Fig. 8 (see Note 6).
3.2.2 2D DOSY NMR
Spectrum
Free Quercetin
Quercetin-Hp-β-CD
Hp-β-CD H
HO
OH
O
OH
OH
OH
7
6
5
10
8
9
0
4
3
3'
4'
5'
6'
2
2'
1'
2 H
6'H
5'H
8H
6tH
7.5
6.9
6.3
5.7
'H NMR chemical shift (ppm)
'
A
Temozolomide-p-sulfonato-Calixarene
complex
TMZ Imidazole-H
Calix Aromatic-H
Calix CH2-H
TMZ CH3-H
Temozolomide(TMZ)
Imidazole-H
Temerolomide
N
O
O
N
N
N
N
NH3
p-sulfonato-Calixarene
(Calix)
Aromatic - H
HO3S SO3H
SO3H
SO3H
OH
OH OH
OH
p-Sulfomato-Colix[4]arene
CH 3 -H
CH 2 -H
'H NMR chemical shift (ppm)
8
6
4
[PPM]
5.1
B
Fig. 5 (a)
1
H NMR region between 5.0 and 7.8 ppm for free quercetin (red) and its complex (black). Two crucial
observations can be realized. First, the complex contains some new peaks attributed to the presence of
HP-β-CD and second the chemical shifts of the aromatic peaks are shifted downfield. (b)
1
H NMR region
between 3 and 10 ppm for free temozolomide (red), p-sulfonatocalixarene (black), and its complex (green).
Two important observations can be realized; both are regarding the shifts of temozolomide’s imidazole-H and
the methyl group which are both downshifted
Christos M. Chatzigiannis et al.