

103
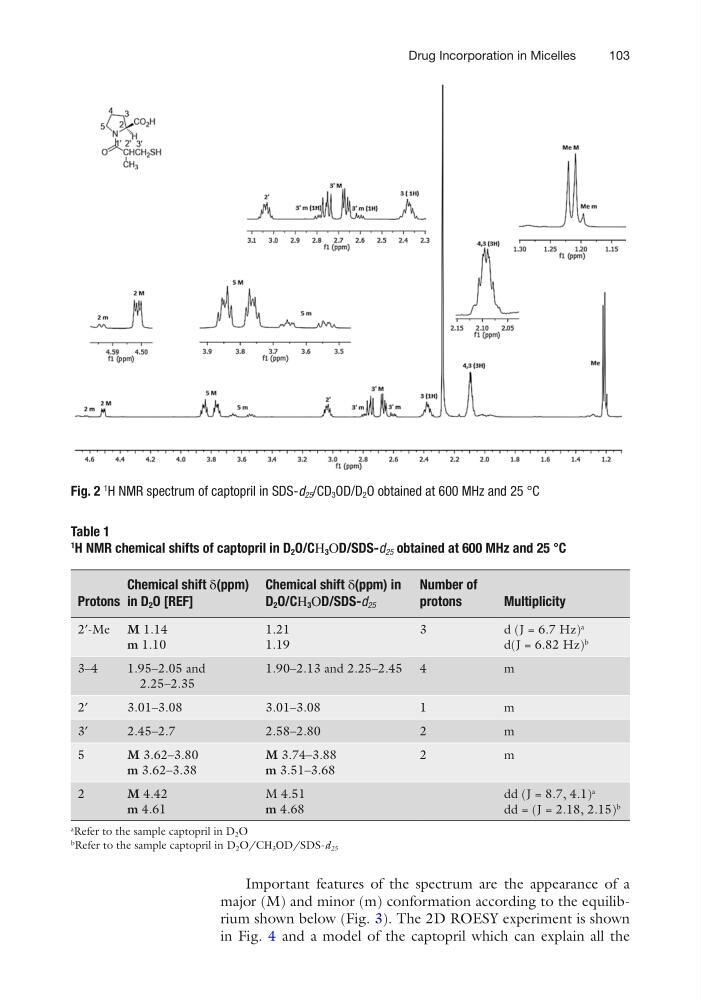
Fig. 2
1
H NMR spectrum of captopril in SDS-d 25 /CD 3 OD/D 2 O obtained at 600 MHz and 25 °C
Table 1
1
H NMR chemical shifts of captopril in D 2 O/CΗ 3 ΟD/SDS-d 25 obtained at 600 MHz and 25 °C
Protons
Chemical shift δ(ppm)
in D 2 O [REF]
Chemical shift δ(ppm) in
D 2 O/CΗ 3 ΟD/SDS-d 25
Number of
protons
Multiplicity
2′-Me M 1.14
m 1.10
1.21
1.19
3
d (J = 6.7 Hz)
a
d(J = 6.82 Hz)
b
3–4
1.95–2.05 and
2.25–2.35
1.90–2.13 and 2.25–2.45 4
m
2′
3.01–3.08
3.01–3.08
1
m
3′
2.45–2.7
2.58–2.80
2
m
5
M 3.62–3.80
m 3.62–3.38
M 3.74–3.88
m 3.51–3.68
2
m
2
M 4.42
m 4.61
M 4.51
m 4.68
dd (J = 8.7, 4.1)
a
dd = (J = 2.18, 2.15)
b
a
Refer to the sample captopril in D 2 O
b
Refer to the sample captopril in D 2 O/CΗ 3 ΟD/SDS-d 25
Important features of the spectrum are the appearance of a
major (M) and minor (m) conformation according to the equilibrium shown below (Fig. 3). The 2D ROESY experiment is shown
in Fig. 4 and a model of the captopril which can explain all the
Drug Incorporation in Micelles
Fig. 2
1
H NMR spectrum of captopril in SDS-d 25 /CD 3 OD/D 2 O obtained at 600 MHz and 25 °C
Table 1
1
H NMR chemical shifts of captopril in D 2 O/CΗ 3 ΟD/SDS-d 25 obtained at 600 MHz and 25 °C
Protons
Chemical shift δ(ppm)
in D 2 O [REF]
Chemical shift δ(ppm) in
D 2 O/CΗ 3 ΟD/SDS-d 25
Number of
protons
Multiplicity
2′-Me M 1.14
m 1.10
1.21
1.19
3
d (J = 6.7 Hz)
a
d(J = 6.82 Hz)
b
3–4
1.95–2.05 and
2.25–2.35
1.90–2.13 and 2.25–2.45 4
m
2′
3.01–3.08
3.01–3.08
1
m
3′
2.45–2.7
2.58–2.80
2
m
5
M 3.62–3.80
m 3.62–3.38
M 3.74–3.88
m 3.51–3.68
2
m
2
M 4.42
m 4.61
M 4.51
m 4.68
dd (J = 8.7, 4.1)
a
dd = (J = 2.18, 2.15)
b
a
Refer to the sample captopril in D 2 O
b
Refer to the sample captopril in D 2 O/CΗ 3 ΟD/SDS-d 25
Important features of the spectrum are the appearance of a
major (M) and minor (m) conformation according to the equilibrium shown below (Fig. 3). The 2D ROESY experiment is shown
in Fig. 4 and a model of the captopril which can explain all the
Drug Incorporation in Micelles