

Sustainable Energy Model in Tecnocampus Higher Education …
783
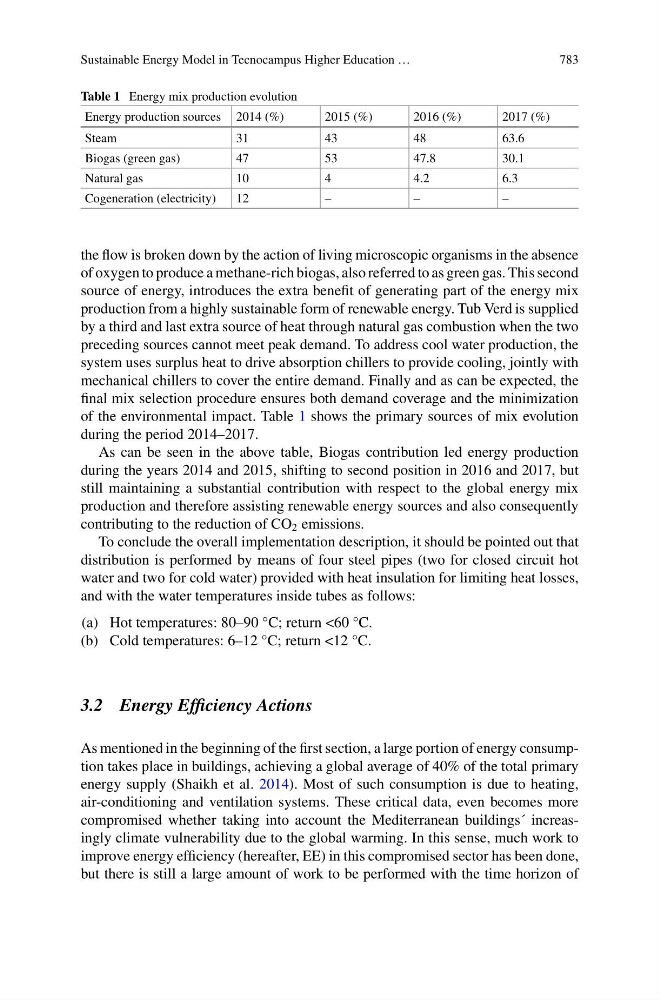
Table 1 Energy mix production evolution
Energy production sources 2014 (%)
2015 (%)
2016 (%)
2017 (%)
Steam
31
43
48
63.6
Biogas (green gas)
47
53
47.8
30.1
Natural gas
10
4
4.2
6.3
Cogeneration (electricity)
12
–
–
–
the flow is broken down by the action of living microscopic organisms in the absence
of oxygen to produce a methane-rich biogas, also referred to as green gas. This second
source of energy, introduces the extra benefit of generating part of the energy mix
production from a highly sustainable form of renewable energy. Tub Verd is supplied
by a third and last extra source of heat through natural gas combustion when the two
preceding sources cannot meet peak demand. To address cool water production, the
system uses surplus heat to drive absorption chillers to provide cooling, jointly with
mechanical chillers to cover the entire demand. Finally and as can be expected, the
final mix selection procedure ensures both demand coverage and the minimization
of the environmental impact. Table 1 shows the primary sources of mix evolution
during the period 2014–2017.
As can be seen in the above table, Biogas contribution led energy production
during the years 2014 and 2015, shifting to second position in 2016 and 2017, but
still maintaining a substantial contribution with respect to the global energy mix
production and therefore assisting renewable energy sources and also consequently
contributing to the reduction of CO 2 emissions.
To conclude the overall implementation description, it should be pointed out that
distribution is performed by means of four steel pipes (two for closed circuit hot
water and two for cold water) provided with heat insulation for limiting heat losses,
and with the water temperatures inside tubes as follows:
(a) Hot temperatures: 80–90 °C; return <60 °C.
(b) Cold temperatures: 6–12 °C; return <12 °C.
3.2 Energy Efficiency Actions
As mentioned in the beginning of the first section, a large portion of energy consumption takes place in buildings, achieving a global average of 40% of the total primary
energy supply (Shaikh et al. 2014). Most of such consumption is due to heating,
air-conditioning and ventilation systems. These critical data, even becomes more
compromised whether taking into account the Mediterranean buildings´ increasingly climate vulnerability due to the global warming. In this sense, much work to
improve energy efficiency (hereafter, EE) in this compromised sector has been done,
but there is still a large amount of work to be performed with the time horizon of