

706
A. Gelpi et al.
Table 2 Age range of survey
respondents
Age range
Responses
17–19 years
13.68%
32
20–24 years
24.79%
58
25–29 years
11.54%
27
30–34 years
13.25%
31
35–39 years
10.68%
25
40–44 years
8.55%
20
45–49 years
8.12%
19
More than 50 years
9.40%
22
Total
234
Table 3 Schooling of survey
respondents
Levels of schooling
Responses
Complete high school
1.28%
3
Undergraduate courses in progress 45.30%
106
Undergraduate
8.97%
21
Specialization/MBA in progress
4.70%
11
Specialization/MBA
11.97%
28
Master’s Degree in progress
3.85%
9
Master’s Degree
13.25%
31
Ph.D. in progress
2.99%
7
Ph.D. completed
7.69%
18
Total
234
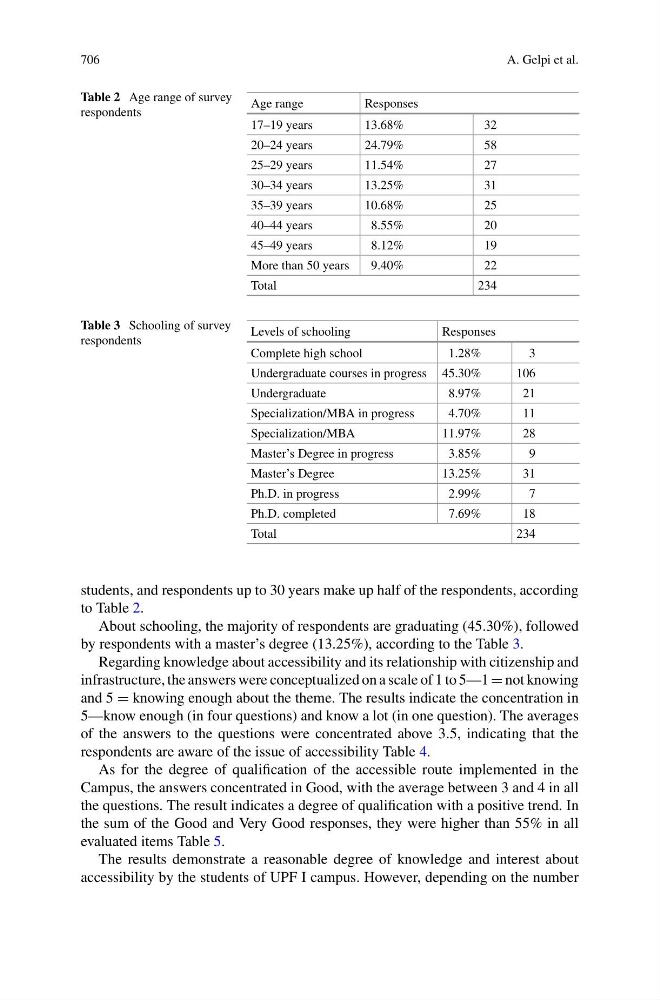
students, and respondents up to 30 years make up half of the respondents, according
to Table 2.
About schooling, the majority of respondents are graduating (45.30%), followed
by respondents with a master’s degree (13.25%), according to the Table 3.
Regarding knowledge about accessibility and its relationship with citizenship and
infrastructure, the answers were conceptualized on a scale of 1 to 5—1 = not knowing
and 5 = knowing enough about the theme. The results indicate the concentration in
5—know enough (in four questions) and know a lot (in one question). The averages
of the answers to the questions were concentrated above 3.5, indicating that the
respondents are aware of the issue of accessibility Table 4.
As for the degree of qualification of the accessible route implemented in the
Campus, the answers concentrated in Good, with the average between 3 and 4 in all
the questions. The result indicates a degree of qualification with a positive trend. In
the sum of the Good and Very Good responses, they were higher than 55% in all
evaluated items Table 5.
The results demonstrate a reasonable degree of knowledge and interest about
accessibility by the students of UPF I campus. However, depending on the number