

52
L. L. Brandli et al.
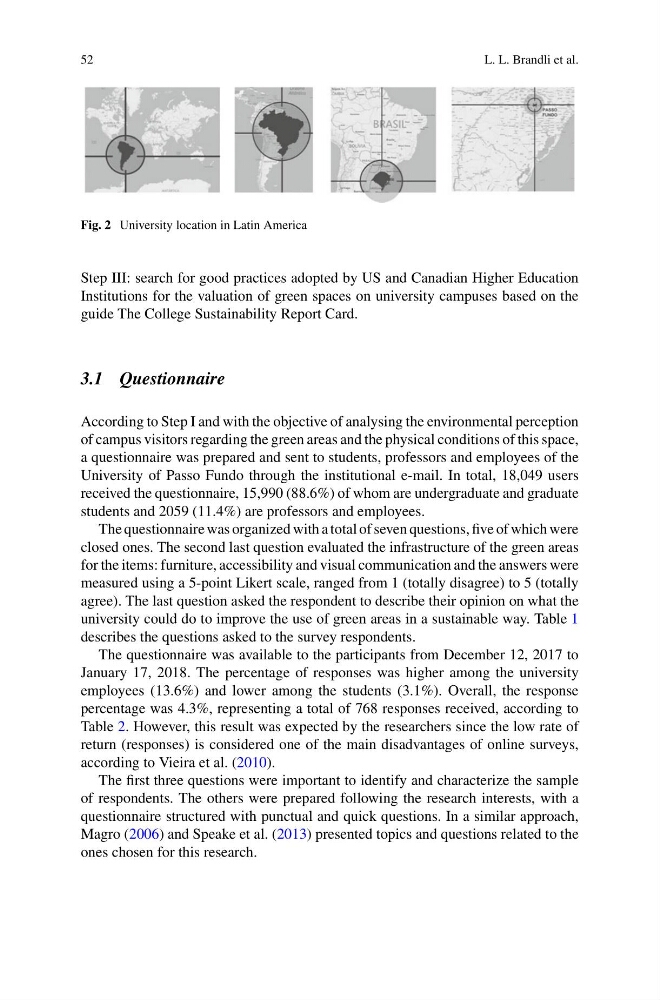
Fig. 2 University location in Latin America
Step III: search for good practices adopted by US and Canadian Higher Education
Institutions for the valuation of green spaces on university campuses based on the
guide The College Sustainability Report Card.
3.1 Questionnaire
According to Step I and with the objective of analysing the environmental perception
of campus visitors regarding the green areas and the physical conditions of this space,
a questionnaire was prepared and sent to students, professors and employees of the
University of Passo Fundo through the institutional e-mail. In total, 18,049 users
received the questionnaire, 15,990 (88.6%) of whom are undergraduate and graduate
students and 2059 (11.4%) are professors and employees.
The questionnaire was organized with a total of seven questions, five of which were
closed ones. The second last question evaluated the infrastructure of the green areas
for the items: furniture, accessibility and visual communication and the answers were
measured using a 5-point Likert scale, ranged from 1 (totally disagree) to 5 (totally
agree). The last question asked the respondent to describe their opinion on what the
university could do to improve the use of green areas in a sustainable way. Table 1
describes the questions asked to the survey respondents.
The questionnaire was available to the participants from December 12, 2017 to
January 17, 2018. The percentage of responses was higher among the university
employees (13.6%) and lower among the students (3.1%). Overall, the response
percentage was 4.3%, representing a total of 768 responses received, according to
Table 2. However, this result was expected by the researchers since the low rate of
return (responses) is considered one of the main disadvantages of online surveys,
according to Vieira et al. (2010).
The first three questions were important to identify and characterize the sample
of respondents. The others were prepared following the research interests, with a
questionnaire structured with punctual and quick questions. In a similar approach,
Magro (2006) and Speake et al. (2013) presented topics and questions related to the
ones chosen for this research.
L. L. Brandli et al.
Fig. 2 University location in Latin America
Step III: search for good practices adopted by US and Canadian Higher Education
Institutions for the valuation of green spaces on university campuses based on the
guide The College Sustainability Report Card.
3.1 Questionnaire
According to Step I and with the objective of analysing the environmental perception
of campus visitors regarding the green areas and the physical conditions of this space,
a questionnaire was prepared and sent to students, professors and employees of the
University of Passo Fundo through the institutional e-mail. In total, 18,049 users
received the questionnaire, 15,990 (88.6%) of whom are undergraduate and graduate
students and 2059 (11.4%) are professors and employees.
The questionnaire was organized with a total of seven questions, five of which were
closed ones. The second last question evaluated the infrastructure of the green areas
for the items: furniture, accessibility and visual communication and the answers were
measured using a 5-point Likert scale, ranged from 1 (totally disagree) to 5 (totally
agree). The last question asked the respondent to describe their opinion on what the
university could do to improve the use of green areas in a sustainable way. Table 1
describes the questions asked to the survey respondents.
The questionnaire was available to the participants from December 12, 2017 to
January 17, 2018. The percentage of responses was higher among the university
employees (13.6%) and lower among the students (3.1%). Overall, the response
percentage was 4.3%, representing a total of 768 responses received, according to
Table 2. However, this result was expected by the researchers since the low rate of
return (responses) is considered one of the main disadvantages of online surveys,
according to Vieira et al. (2010).
The first three questions were important to identify and characterize the sample
of respondents. The others were prepared following the research interests, with a
questionnaire structured with punctual and quick questions. In a similar approach,
Magro (2006) and Speake et al. (2013) presented topics and questions related to the
ones chosen for this research.