

218
Z. A. Danial Hariz and M. A. Noor Adelyna
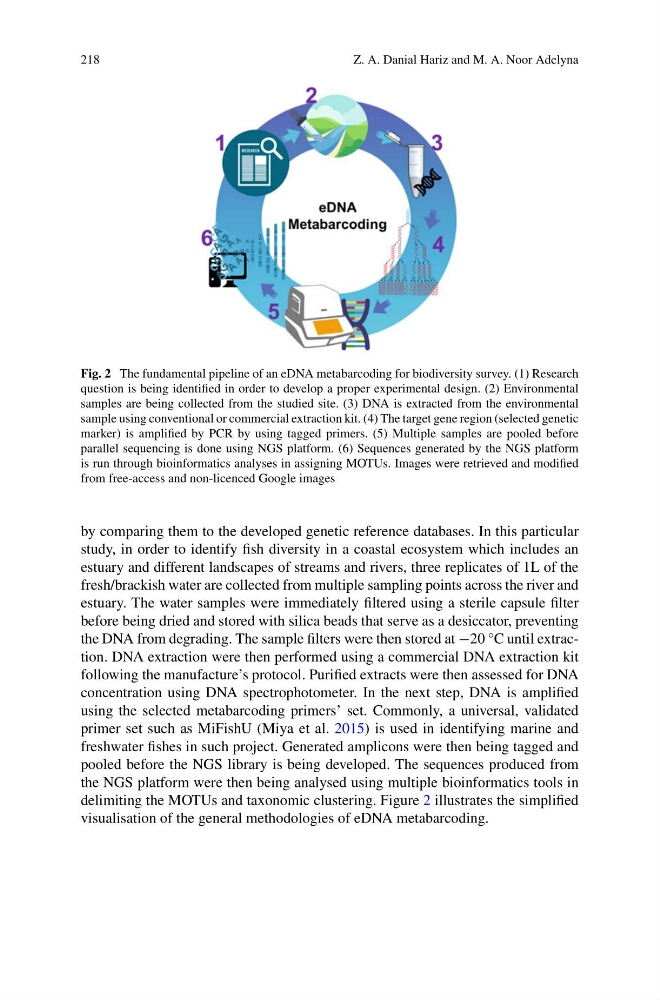
Fig. 2 The fundamental pipeline of an eDNA metabarcoding for biodiversity survey. (1) Research
question is being identified in order to develop a proper experimental design. (2) Environmental
samples are being collected from the studied site. (3) DNA is extracted from the environmental
sample using conventional or commercial extraction kit. (4) The target gene region (selected genetic
marker) is amplified by PCR by using tagged primers. (5) Multiple samples are pooled before
parallel sequencing is done using NGS platform. (6) Sequences generated by the NGS platform
is run through bioinformatics analyses in assigning MOTUs. Images were retrieved and modified
from free-access and non-licenced Google images
by comparing them to the developed genetic reference databases. In this particular
study, in order to identify fish diversity in a coastal ecosystem which includes an
estuary and different landscapes of streams and rivers, three replicates of 1L of the
fresh/brackish water are collected from multiple sampling points across the river and
estuary. The water samples were immediately filtered using a sterile capsule filter
before being dried and stored with silica beads that serve as a desiccator, preventing
the DNA from degrading. The sample filters were then stored at −20 °C until extraction. DNA extraction were then performed using a commercial DNA extraction kit
following the manufacture’s protocol. Purified extracts were then assessed for DNA
concentration using DNA spectrophotometer. In the next step, DNA is amplified
using the selected metabarcoding primers’ set. Commonly, a universal, validated
primer set such as MiFishU (Miya et al. 2015) is used in identifying marine and
freshwater fishes in such project. Generated amplicons were then being tagged and
pooled before the NGS library is being developed. The sequences produced from
the NGS platform were then being analysed using multiple bioinformatics tools in
delimiting the MOTUs and taxonomic clustering. Figure 2 illustrates the simplified
visualisation of the general methodologies of eDNA metabarcoding.
Z. A. Danial Hariz and M. A. Noor Adelyna
Fig. 2 The fundamental pipeline of an eDNA metabarcoding for biodiversity survey. (1) Research
question is being identified in order to develop a proper experimental design. (2) Environmental
samples are being collected from the studied site. (3) DNA is extracted from the environmental
sample using conventional or commercial extraction kit. (4) The target gene region (selected genetic
marker) is amplified by PCR by using tagged primers. (5) Multiple samples are pooled before
parallel sequencing is done using NGS platform. (6) Sequences generated by the NGS platform
is run through bioinformatics analyses in assigning MOTUs. Images were retrieved and modified
from free-access and non-licenced Google images
by comparing them to the developed genetic reference databases. In this particular
study, in order to identify fish diversity in a coastal ecosystem which includes an
estuary and different landscapes of streams and rivers, three replicates of 1L of the
fresh/brackish water are collected from multiple sampling points across the river and
estuary. The water samples were immediately filtered using a sterile capsule filter
before being dried and stored with silica beads that serve as a desiccator, preventing
the DNA from degrading. The sample filters were then stored at −20 °C until extraction. DNA extraction were then performed using a commercial DNA extraction kit
following the manufacture’s protocol. Purified extracts were then assessed for DNA
concentration using DNA spectrophotometer. In the next step, DNA is amplified
using the selected metabarcoding primers’ set. Commonly, a universal, validated
primer set such as MiFishU (Miya et al. 2015) is used in identifying marine and
freshwater fishes in such project. Generated amplicons were then being tagged and
pooled before the NGS library is being developed. The sequences produced from
the NGS platform were then being analysed using multiple bioinformatics tools in
delimiting the MOTUs and taxonomic clustering. Figure 2 illustrates the simplified
visualisation of the general methodologies of eDNA metabarcoding.