

Environmental DNA (eDNA) Metabarcoding as a Sustainable Tool …
213
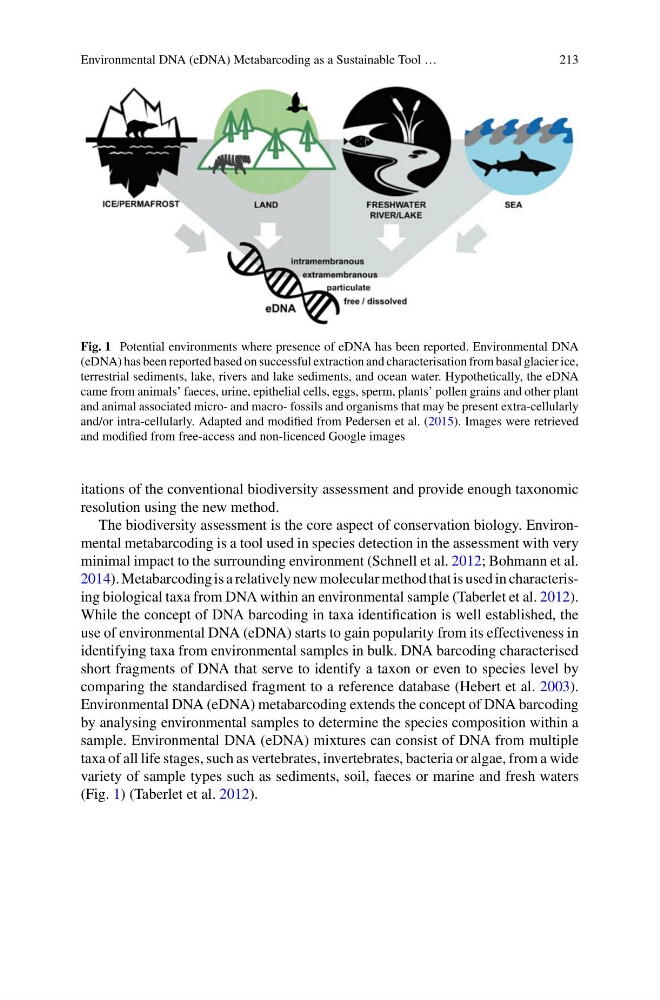
Fig. 1 Potential environments where presence of eDNA has been reported. Environmental DNA
(eDNA) has been reported based on successful extraction and characterisation from basal glacier ice,
terrestrial sediments, lake, rivers and lake sediments, and ocean water. Hypothetically, the eDNA
came from animals’ faeces, urine, epithelial cells, eggs, sperm, plants’ pollen grains and other plant
and animal associated micro- and macro- fossils and organisms that may be present extra-cellularly
and/or intra-cellularly. Adapted and modified from Pedersen et al. (2015). Images were retrieved
and modified from free-access and non-licenced Google images
itations of the conventional biodiversity assessment and provide enough taxonomic
resolution using the new method.
The biodiversity assessment is the core aspect of conservation biology. Environmental metabarcoding is a tool used in species detection in the assessment with very
minimal impact to the surrounding environment (Schnell et al. 2012; Bohmann et al.
2014). Metabarcoding is a relatively new molecular method that is used in characterising biological taxa from DNA within an environmental sample (Taberlet et al. 2012).
While the concept of DNA barcoding in taxa identification is well established, the
use of environmental DNA (eDNA) starts to gain popularity from its effectiveness in
identifying taxa from environmental samples in bulk. DNA barcoding characterised
short fragments of DNA that serve to identify a taxon or even to species level by
comparing the standardised fragment to a reference database (Hebert et al. 2003).
Environmental DNA (eDNA) metabarcoding extends the concept of DNA barcoding
by analysing environmental samples to determine the species composition within a
sample. Environmental DNA (eDNA) mixtures can consist of DNA from multiple
taxa of all life stages, such as vertebrates, invertebrates, bacteria or algae, from a wide
variety of sample types such as sediments, soil, faeces or marine and fresh waters
(Fig. 1) (Taberlet et al. 2012).
213
Fig. 1 Potential environments where presence of eDNA has been reported. Environmental DNA
(eDNA) has been reported based on successful extraction and characterisation from basal glacier ice,
terrestrial sediments, lake, rivers and lake sediments, and ocean water. Hypothetically, the eDNA
came from animals’ faeces, urine, epithelial cells, eggs, sperm, plants’ pollen grains and other plant
and animal associated micro- and macro- fossils and organisms that may be present extra-cellularly
and/or intra-cellularly. Adapted and modified from Pedersen et al. (2015). Images were retrieved
and modified from free-access and non-licenced Google images
itations of the conventional biodiversity assessment and provide enough taxonomic
resolution using the new method.
The biodiversity assessment is the core aspect of conservation biology. Environmental metabarcoding is a tool used in species detection in the assessment with very
minimal impact to the surrounding environment (Schnell et al. 2012; Bohmann et al.
2014). Metabarcoding is a relatively new molecular method that is used in characterising biological taxa from DNA within an environmental sample (Taberlet et al. 2012).
While the concept of DNA barcoding in taxa identification is well established, the
use of environmental DNA (eDNA) starts to gain popularity from its effectiveness in
identifying taxa from environmental samples in bulk. DNA barcoding characterised
short fragments of DNA that serve to identify a taxon or even to species level by
comparing the standardised fragment to a reference database (Hebert et al. 2003).
Environmental DNA (eDNA) metabarcoding extends the concept of DNA barcoding
by analysing environmental samples to determine the species composition within a
sample. Environmental DNA (eDNA) mixtures can consist of DNA from multiple
taxa of all life stages, such as vertebrates, invertebrates, bacteria or algae, from a wide
variety of sample types such as sediments, soil, faeces or marine and fresh waters
(Fig. 1) (Taberlet et al. 2012).