

19 Analysis of Water Molecules in the Hras-GTP and GDP Complexes
357
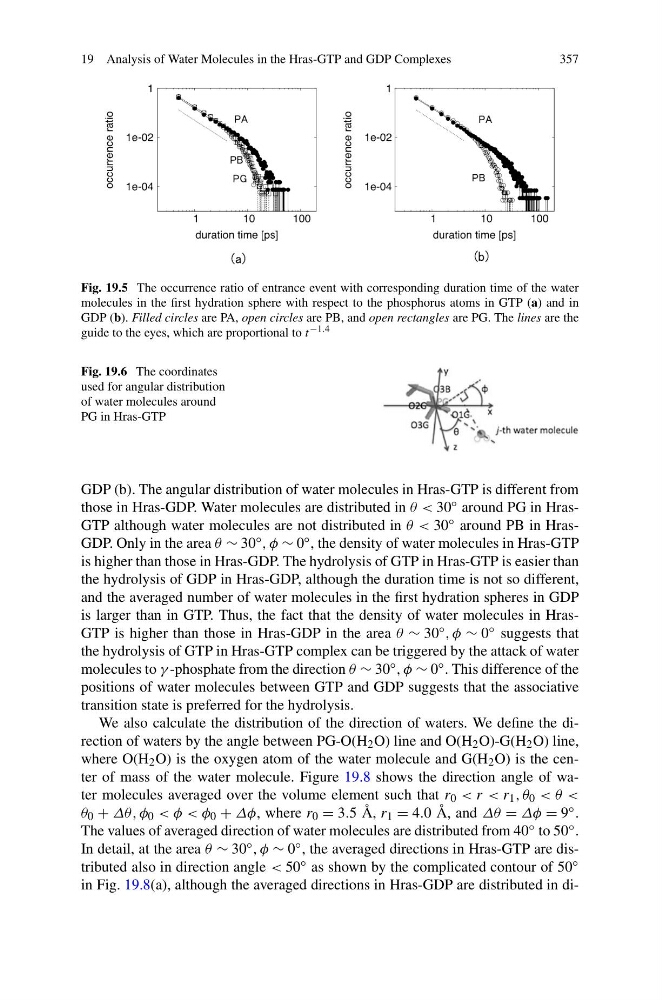
Fig. 19.5 The occurrence ratio of entrance event with corresponding duration time of the water
molecules in the first hydration sphere with respect to the phosphorus atoms in GTP (a) and in
GDP (b). Filled circles are PA, open circles are PB, and open rectangles are PG. The lines are the
guide to the eyes, which are proportional to t −1.4
Fig. 19.6 The coordinates
used for angular distribution
of water molecules around
PG in Hras-GTP
GDP (b). The angular distribution of water molecules in Hras-GTP is different from
those in Hras-GDP. Water molecules are distributed in θ < 30 ◦ around PG in HrasGTP although water molecules are not distributed in θ < 30 ◦ around PB in HrasGDP. Only in the area θ ∼ 30 ◦ , φ ∼ 0 ◦ , the density of water molecules in Hras-GTP
is higher than those in Hras-GDP. The hydrolysis of GTP in Hras-GTP is easier than
the hydrolysis of GDP in Hras-GDP, although the duration time is not so different,
and the averaged number of water molecules in the first hydration spheres in GDP
is larger than in GTP. Thus, the fact that the density of water molecules in HrasGTP is higher than those in Hras-GDP in the area θ ∼ 30 ◦ , φ ∼ 0 ◦ suggests that
the hydrolysis of GTP in Hras-GTP complex can be triggered by the attack of water
molecules to γ -phosphate from the direction θ ∼ 30 ◦ , φ ∼ 0 ◦ . This difference of the
positions of water molecules between GTP and GDP suggests that the associative
transition state is preferred for the hydrolysis.
We also calculate the distribution of the direction of waters. We define the direction of waters by the angle between PG-O(H 2 O) line and O(H 2 O)-G(H 2 O) line,
where O(H 2 O) is the oxygen atom of the water molecule and G(H 2 O) is the center of mass of the water molecule. Figure 19.8 shows the direction angle of water molecules averaged over the volume element such that r 0 < r < r 1 , θ 0 < θ <
θ 0 + Δθ, φ 0 < φ < φ 0 + Δφ, where r 0 = 3.5 Å, r 1 = 4.0 Å, and Δθ = Δφ = 9 ◦ .
The values of averaged direction of water molecules are distributed from 40 ◦ to 50 ◦ .
In detail, at the area θ ∼ 30 ◦ , φ ∼ 0 ◦ , the averaged directions in Hras-GTP are distributed also in direction angle < 50 ◦ as shown by the complicated contour of 50 ◦
in Fig. 19.8(a), although the averaged directions in Hras-GDP are distributed in di-
357
Fig. 19.5 The occurrence ratio of entrance event with corresponding duration time of the water
molecules in the first hydration sphere with respect to the phosphorus atoms in GTP (a) and in
GDP (b). Filled circles are PA, open circles are PB, and open rectangles are PG. The lines are the
guide to the eyes, which are proportional to t −1.4
Fig. 19.6 The coordinates
used for angular distribution
of water molecules around
PG in Hras-GTP
GDP (b). The angular distribution of water molecules in Hras-GTP is different from
those in Hras-GDP. Water molecules are distributed in θ < 30 ◦ around PG in HrasGTP although water molecules are not distributed in θ < 30 ◦ around PB in HrasGDP. Only in the area θ ∼ 30 ◦ , φ ∼ 0 ◦ , the density of water molecules in Hras-GTP
is higher than those in Hras-GDP. The hydrolysis of GTP in Hras-GTP is easier than
the hydrolysis of GDP in Hras-GDP, although the duration time is not so different,
and the averaged number of water molecules in the first hydration spheres in GDP
is larger than in GTP. Thus, the fact that the density of water molecules in HrasGTP is higher than those in Hras-GDP in the area θ ∼ 30 ◦ , φ ∼ 0 ◦ suggests that
the hydrolysis of GTP in Hras-GTP complex can be triggered by the attack of water
molecules to γ -phosphate from the direction θ ∼ 30 ◦ , φ ∼ 0 ◦ . This difference of the
positions of water molecules between GTP and GDP suggests that the associative
transition state is preferred for the hydrolysis.
We also calculate the distribution of the direction of waters. We define the direction of waters by the angle between PG-O(H 2 O) line and O(H 2 O)-G(H 2 O) line,
where O(H 2 O) is the oxygen atom of the water molecule and G(H 2 O) is the center of mass of the water molecule. Figure 19.8 shows the direction angle of water molecules averaged over the volume element such that r 0 < r < r 1 , θ 0 < θ <
θ 0 + Δθ, φ 0 < φ < φ 0 + Δφ, where r 0 = 3.5 Å, r 1 = 4.0 Å, and Δθ = Δφ = 9 ◦ .
The values of averaged direction of water molecules are distributed from 40 ◦ to 50 ◦ .
In detail, at the area θ ∼ 30 ◦ , φ ∼ 0 ◦ , the averaged directions in Hras-GTP are distributed also in direction angle < 50 ◦ as shown by the complicated contour of 50 ◦
in Fig. 19.8(a), although the averaged directions in Hras-GDP are distributed in di-