

17 Theoretical Analysis of Phase-Transition Temperature
323
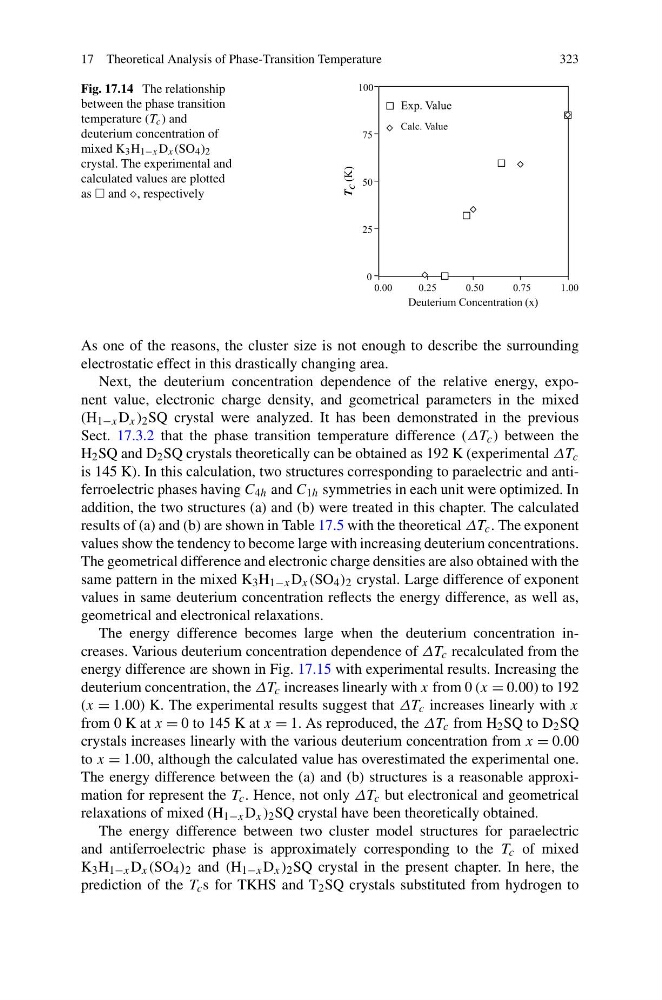
Fig. 17.14 The relationship
between the phase transition
temperature (T c ) and
deuterium concentration of
mixed K 3 H 1−x D x (SO 4 ) 2
crystal. The experimental and
calculated values are plotted
as and , respectively
As one of the reasons, the cluster size is not enough to describe the surrounding
electrostatic effect in this drastically changing area.
Next, the deuterium concentration dependence of the relative energy, exponent value, electronic charge density, and geometrical parameters in the mixed
(H 1−x D x ) 2 SQ crystal were analyzed. It has been demonstrated in the previous
Sect. 17.3.2 that the phase transition temperature difference (ΔT c ) between the
H 2 SQ and D 2 SQ crystals theoretically can be obtained as 192 K (experimental ΔT c
is 145 K). In this calculation, two structures corresponding to paraelectric and antiferroelectric phases having C 4h and C 1h symmetries in each unit were optimized. In
addition, the two structures (a) and (b) were treated in this chapter. The calculated
results of (a) and (b) are shown in Table 17.5 with the theoretical ΔT c . The exponent
values show the tendency to become large with increasing deuterium concentrations.
The geometrical difference and electronic charge densities are also obtained with the
same pattern in the mixed K 3 H 1−x D x (SO 4 ) 2 crystal. Large difference of exponent
values in same deuterium concentration reflects the energy difference, as well as,
geometrical and electronical relaxations.
The energy difference becomes large when the deuterium concentration increases. Various deuterium concentration dependence of ΔT c recalculated from the
energy difference are shown in Fig. 17.15 with experimental results. Increasing the
deuterium concentration, the ΔT c increases linearly with x from 0 (x = 0.00) to 192
(x = 1.00) K. The experimental results suggest that ΔT c increases linearly with x
from 0 K at x = 0 to 145 K at x = 1. As reproduced, the ΔT c from H 2 SQ to D 2 SQ
crystals increases linearly with the various deuterium concentration from x = 0.00
to x = 1.00, although the calculated value has overestimated the experimental one.
The energy difference between the (a) and (b) structures is a reasonable approximation for represent the T c . Hence, not only ΔT c but electronical and geometrical
relaxations of mixed (H 1−x D x ) 2 SQ crystal have been theoretically obtained.
The energy difference between two cluster model structures for paraelectric
and antiferroelectric phase is approximately corresponding to the T c of mixed
K 3 H 1−x D x (SO 4 ) 2 and (H 1−x D x ) 2 SQ crystal in the present chapter. In here, the
prediction of the T c s for TKHS and T 2 SQ crystals substituted from hydrogen to
323
Fig. 17.14 The relationship
between the phase transition
temperature (T c ) and
deuterium concentration of
mixed K 3 H 1−x D x (SO 4 ) 2
crystal. The experimental and
calculated values are plotted
as and , respectively
As one of the reasons, the cluster size is not enough to describe the surrounding
electrostatic effect in this drastically changing area.
Next, the deuterium concentration dependence of the relative energy, exponent value, electronic charge density, and geometrical parameters in the mixed
(H 1−x D x ) 2 SQ crystal were analyzed. It has been demonstrated in the previous
Sect. 17.3.2 that the phase transition temperature difference (ΔT c ) between the
H 2 SQ and D 2 SQ crystals theoretically can be obtained as 192 K (experimental ΔT c
is 145 K). In this calculation, two structures corresponding to paraelectric and antiferroelectric phases having C 4h and C 1h symmetries in each unit were optimized. In
addition, the two structures (a) and (b) were treated in this chapter. The calculated
results of (a) and (b) are shown in Table 17.5 with the theoretical ΔT c . The exponent
values show the tendency to become large with increasing deuterium concentrations.
The geometrical difference and electronic charge densities are also obtained with the
same pattern in the mixed K 3 H 1−x D x (SO 4 ) 2 crystal. Large difference of exponent
values in same deuterium concentration reflects the energy difference, as well as,
geometrical and electronical relaxations.
The energy difference becomes large when the deuterium concentration increases. Various deuterium concentration dependence of ΔT c recalculated from the
energy difference are shown in Fig. 17.15 with experimental results. Increasing the
deuterium concentration, the ΔT c increases linearly with x from 0 (x = 0.00) to 192
(x = 1.00) K. The experimental results suggest that ΔT c increases linearly with x
from 0 K at x = 0 to 145 K at x = 1. As reproduced, the ΔT c from H 2 SQ to D 2 SQ
crystals increases linearly with the various deuterium concentration from x = 0.00
to x = 1.00, although the calculated value has overestimated the experimental one.
The energy difference between the (a) and (b) structures is a reasonable approximation for represent the T c . Hence, not only ΔT c but electronical and geometrical
relaxations of mixed (H 1−x D x ) 2 SQ crystal have been theoretically obtained.
The energy difference between two cluster model structures for paraelectric
and antiferroelectric phase is approximately corresponding to the T c of mixed
K 3 H 1−x D x (SO 4 ) 2 and (H 1−x D x ) 2 SQ crystal in the present chapter. In here, the
prediction of the T c s for TKHS and T 2 SQ crystals substituted from hydrogen to