

17 Theoretical Analysis of Phase-Transition Temperature
317
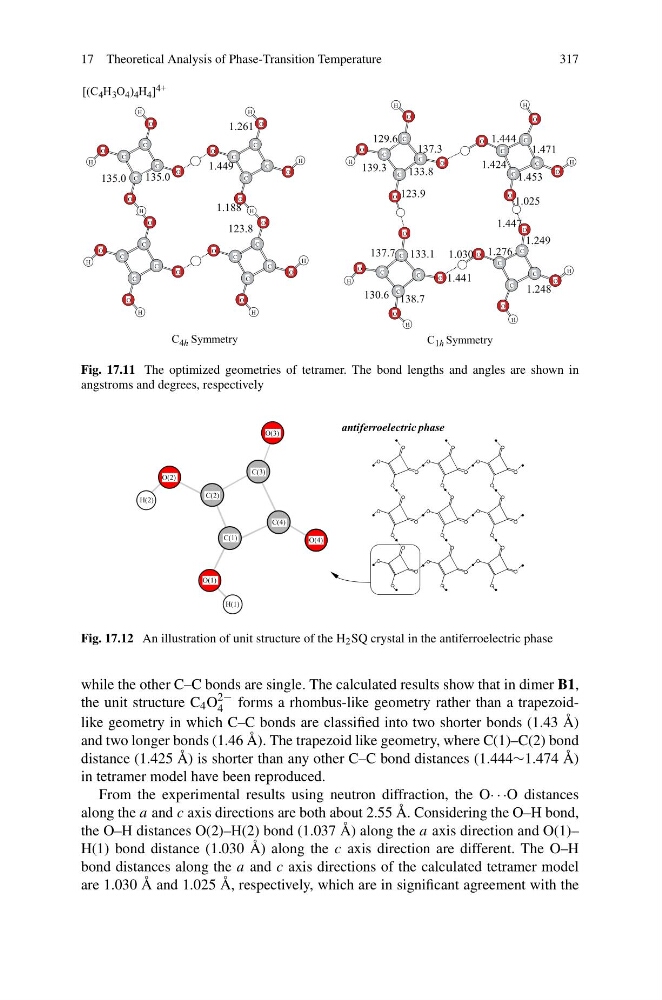
Fig. 17.11 The optimized geometries of tetramer. The bond lengths and angles are shown in
angstroms and degrees, respectively
Fig. 17.12 An illustration of unit structure of the H 2 SQ crystal in the antiferroelectric phase
while the other C–C bonds are single. The calculated results show that in dimer B1,
the unit structure C 4 O
2−
4 forms a rhombus-like geometry rather than a trapezoidlike geometry in which C–C bonds are classified into two shorter bonds (1.43 Å)
and two longer bonds (1.46 Å). The trapezoid like geometry, where C(1)–C(2) bond
distance (1.425 Å) is shorter than any other C–C bond distances (1.444∼1.474 Å)
in tetramer model have been reproduced.
From the experimental results using neutron diffraction, the O· · ·O distances
along the a and c axis directions are both about 2.55 Å. Considering the O–H bond,
the O–H distances O(2)–H(2) bond (1.037 Å) along the a axis direction and O(1)–
H(1) bond distance (1.030 Å) along the c axis direction are different. The O–H
bond distances along the a and c axis directions of the calculated tetramer model
are 1.030 Å and 1.025 Å, respectively, which are in significant agreement with the
317
Fig. 17.11 The optimized geometries of tetramer. The bond lengths and angles are shown in
angstroms and degrees, respectively
Fig. 17.12 An illustration of unit structure of the H 2 SQ crystal in the antiferroelectric phase
while the other C–C bonds are single. The calculated results show that in dimer B1,
the unit structure C 4 O
2−
4 forms a rhombus-like geometry rather than a trapezoidlike geometry in which C–C bonds are classified into two shorter bonds (1.43 Å)
and two longer bonds (1.46 Å). The trapezoid like geometry, where C(1)–C(2) bond
distance (1.425 Å) is shorter than any other C–C bond distances (1.444∼1.474 Å)
in tetramer model have been reproduced.
From the experimental results using neutron diffraction, the O· · ·O distances
along the a and c axis directions are both about 2.55 Å. Considering the O–H bond,
the O–H distances O(2)–H(2) bond (1.037 Å) along the a axis direction and O(1)–
H(1) bond distance (1.030 Å) along the c axis direction are different. The O–H
bond distances along the a and c axis directions of the calculated tetramer model
are 1.030 Å and 1.025 Å, respectively, which are in significant agreement with the