

10 Structural and Thermodynamic Properties of Au 2–58 Clusters
187
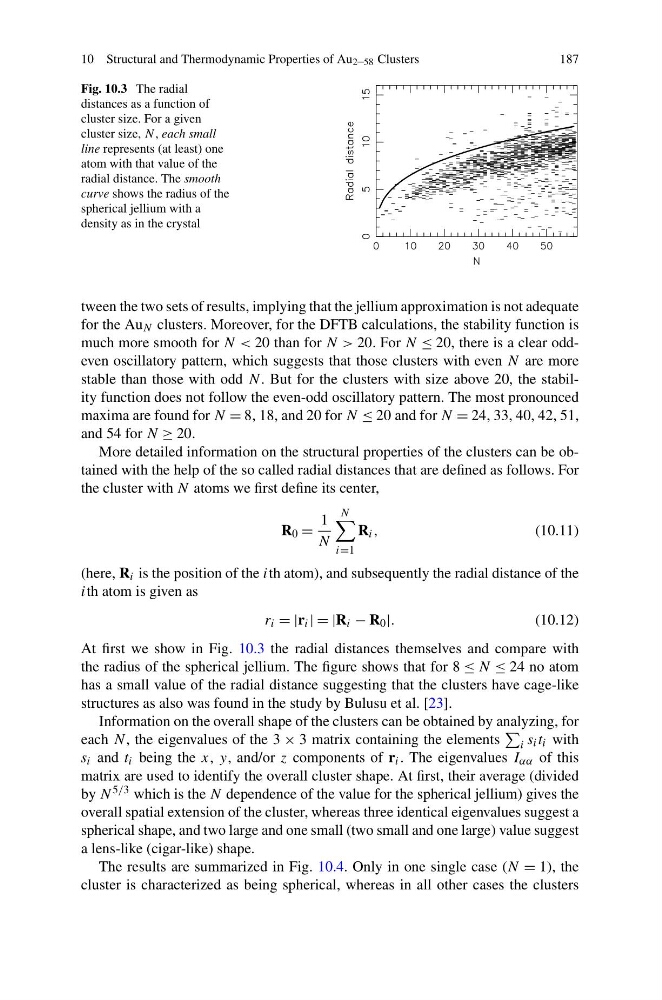
Fig. 10.3 The radial
distances as a function of
cluster size. For a given
cluster size, N , each small
line represents (at least) one
atom with that value of the
radial distance. The smooth
curve shows the radius of the
spherical jellium with a
density as in the crystal
tween the two sets of results, implying that the jellium approximation is not adequate
for the Au N clusters. Moreover, for the DFTB calculations, the stability function is
much more smooth for N < 20 than for N > 20. For N ≤ 20, there is a clear oddeven oscillatory pattern, which suggests that those clusters with even N are more
stable than those with odd N . But for the clusters with size above 20, the stability function does not follow the even-odd oscillatory pattern. The most pronounced
maxima are found for N = 8, 18, and 20 for N ≤ 20 and for N = 24, 33, 40, 42, 51,
and 54 for N ≥ 20.
More detailed information on the structural properties of the clusters can be obtained with the help of the so called radial distances that are defined as follows. For
the cluster with N atoms we first define its center,
R 0 =
1
N
N
i=1
R i ,
(10.11)
(here, R i is the position of the ith atom), and subsequently the radial distance of the
ith atom is given as
r i = |r i | = |R i − R 0 |.
(10.12)
At first we show in Fig. 10.3 the radial distances themselves and compare with
the radius of the spherical jellium. The figure shows that for 8 ≤ N ≤ 24 no atom
has a small value of the radial distance suggesting that the clusters have cage-like
structures as also was found in the study by Bulusu et al. [23].
Information on the overall shape of the clusters can be obtained by analyzing, for
each N , the eigenvalues of the 3 × 3 matrix containing the elements
i s i t i with
s i and t i being the x, y, and/or z components of r i . The eigenvalues I αα of this
matrix are used to identify the overall cluster shape. At first, their average (divided
by N 5/3 which is the N dependence of the value for the spherical jellium) gives the
overall spatial extension of the cluster, whereas three identical eigenvalues suggest a
spherical shape, and two large and one small (two small and one large) value suggest
a lens-like (cigar-like) shape.
The results are summarized in Fig. 10.4. Only in one single case (N = 1), the
cluster is characterized as being spherical, whereas in all other cases the clusters
187
Fig. 10.3 The radial
distances as a function of
cluster size. For a given
cluster size, N , each small
line represents (at least) one
atom with that value of the
radial distance. The smooth
curve shows the radius of the
spherical jellium with a
density as in the crystal
tween the two sets of results, implying that the jellium approximation is not adequate
for the Au N clusters. Moreover, for the DFTB calculations, the stability function is
much more smooth for N < 20 than for N > 20. For N ≤ 20, there is a clear oddeven oscillatory pattern, which suggests that those clusters with even N are more
stable than those with odd N . But for the clusters with size above 20, the stability function does not follow the even-odd oscillatory pattern. The most pronounced
maxima are found for N = 8, 18, and 20 for N ≤ 20 and for N = 24, 33, 40, 42, 51,
and 54 for N ≥ 20.
More detailed information on the structural properties of the clusters can be obtained with the help of the so called radial distances that are defined as follows. For
the cluster with N atoms we first define its center,
R 0 =
1
N
N
i=1
R i ,
(10.11)
(here, R i is the position of the ith atom), and subsequently the radial distance of the
ith atom is given as
r i = |r i | = |R i − R 0 |.
(10.12)
At first we show in Fig. 10.3 the radial distances themselves and compare with
the radius of the spherical jellium. The figure shows that for 8 ≤ N ≤ 24 no atom
has a small value of the radial distance suggesting that the clusters have cage-like
structures as also was found in the study by Bulusu et al. [23].
Information on the overall shape of the clusters can be obtained by analyzing, for
each N , the eigenvalues of the 3 × 3 matrix containing the elements
i s i t i with
s i and t i being the x, y, and/or z components of r i . The eigenvalues I αα of this
matrix are used to identify the overall cluster shape. At first, their average (divided
by N 5/3 which is the N dependence of the value for the spherical jellium) gives the
overall spatial extension of the cluster, whereas three identical eigenvalues suggest a
spherical shape, and two large and one small (two small and one large) value suggest
a lens-like (cigar-like) shape.
The results are summarized in Fig. 10.4. Only in one single case (N = 1), the
cluster is characterized as being spherical, whereas in all other cases the clusters