

cycles through time. Key discoveries include molecular confirmation that
cyanobacteria were already producing major amounts of oxygen 2.5 billion years
ago and that organisms with structurally complex eukaryotic cells were
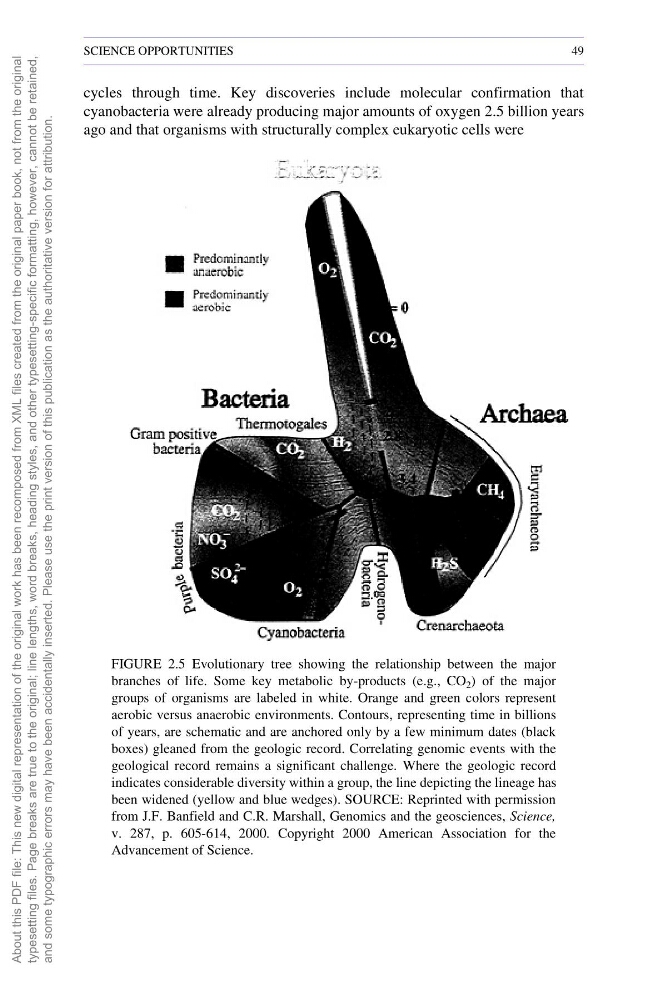
FIGURE 2.5 Evolutionary tree showing the relationship between the major
branches of life. Some key metabolic by-products (e.g., CO 2 ) of the major
groups of organisms are labeled in white. Orange and green colors represent
aerobic versus anaerobic environments. Contours, representing time in billions
of years, are schematic and are anchored only by a few minimum dates (black
boxes) gleaned from the geologic record. Correlating genomic events with the
geological record remains a significant challenge. Where the geologic record
indicates considerable diversity within a group, the line depicting the lineage has
been widened (yellow and blue wedges). SOURCE: Reprinted with permission
from J.F. Banfield and C.R. Marshall, Genomics and the geosciences, Science,
v. 287, p. 605-614, 2000. Copyright 2000 American Association for the
Advancement of Science.
SCIENCE OPPORTUNITIES
49
About this PDF file: This new digital representation of the
original work has been recomposed from XML files created
from the original paper book, not from the original
typesetting files. Page breaks are true to the original; line lengths,
word breaks, heading styles, and other typesetting-specific
formatting, however, cannot be retained,
and some typographic errors may have been accidentally inserted.
Please use the print version of this publication as the authoritative
version for attribution.
cyanobacteria were already producing major amounts of oxygen 2.5 billion years
ago and that organisms with structurally complex eukaryotic cells were
FIGURE 2.5 Evolutionary tree showing the relationship between the major
branches of life. Some key metabolic by-products (e.g., CO 2 ) of the major
groups of organisms are labeled in white. Orange and green colors represent
aerobic versus anaerobic environments. Contours, representing time in billions
of years, are schematic and are anchored only by a few minimum dates (black
boxes) gleaned from the geologic record. Correlating genomic events with the
geological record remains a significant challenge. Where the geologic record
indicates considerable diversity within a group, the line depicting the lineage has
been widened (yellow and blue wedges). SOURCE: Reprinted with permission
from J.F. Banfield and C.R. Marshall, Genomics and the geosciences, Science,
v. 287, p. 605-614, 2000. Copyright 2000 American Association for the
Advancement of Science.
SCIENCE OPPORTUNITIES
49
About this PDF file: This new digital representation of the
original work has been recomposed from XML files created
from the original paper book, not from the original
typesetting files. Page breaks are true to the original; line lengths,
word breaks, heading styles, and other typesetting-specific
formatting, however, cannot be retained,
and some typographic errors may have been accidentally inserted.
Please use the print version of this publication as the authoritative
version for attribution.