

156
H. Sun et al.
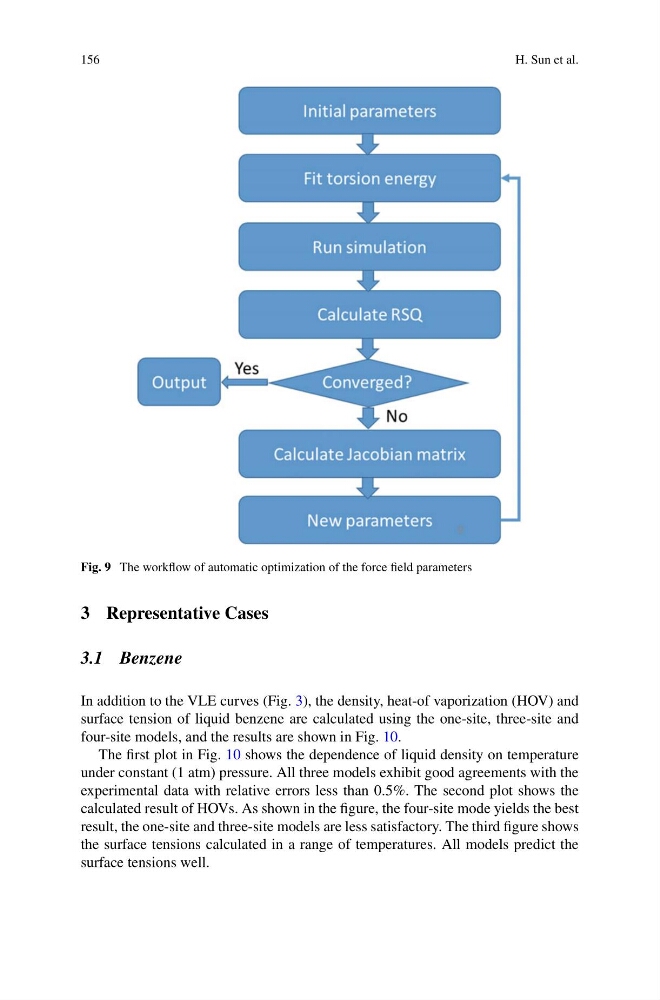
Fig. 9 The workflow of automatic optimization of the force field parameters
3 Representative Cases
3.1 Benzene
In addition to the VLE curves (Fig. 3), the density, heat-of vaporization (HOV) and
surface tension of liquid benzene are calculated using the one-site, three-site and
four-site models, and the results are shown in Fig. 10.
The first plot in Fig. 10 shows the dependence of liquid density on temperature
under constant (1 atm) pressure. All three models exhibit good agreements with the
experimental data with relative errors less than 0.5%. The second plot shows the
calculated result of HOVs. As shown in the figure, the four-site mode yields the best
result, the one-site and three-site models are less satisfactory. The third figure shows
the surface tensions calculated in a range of temperatures. All models predict the
surface tensions well.
H. Sun et al.
Fig. 9 The workflow of automatic optimization of the force field parameters
3 Representative Cases
3.1 Benzene
In addition to the VLE curves (Fig. 3), the density, heat-of vaporization (HOV) and
surface tension of liquid benzene are calculated using the one-site, three-site and
four-site models, and the results are shown in Fig. 10.
The first plot in Fig. 10 shows the dependence of liquid density on temperature
under constant (1 atm) pressure. All three models exhibit good agreements with the
experimental data with relative errors less than 0.5%. The second plot shows the
calculated result of HOVs. As shown in the figure, the four-site mode yields the best
result, the one-site and three-site models are less satisfactory. The third figure shows
the surface tensions calculated in a range of temperatures. All models predict the
surface tensions well.