

60
Y. Qin et al.
(a)
(b)
(c)
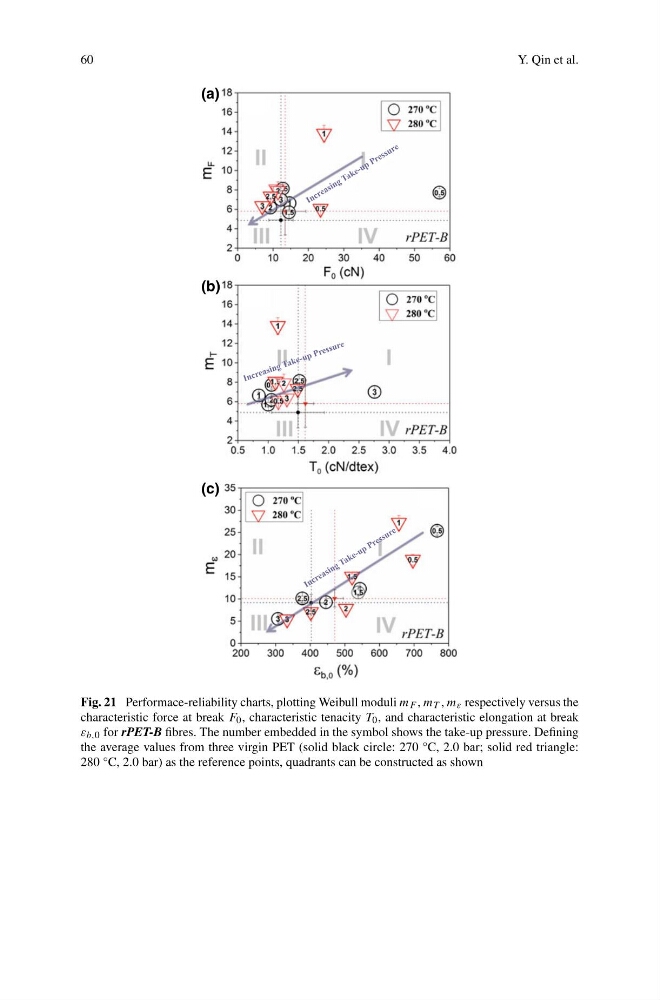
Fig. 21 Performace-reliability charts, plotting Weibull moduli m F , m T , m ε respectively versus the
characteristic force at break F 0 , characteristic tenacity T 0 , and characteristic elongation at break
ε b,0 for rPET-B fibres. The number embedded in the symbol shows the take-up pressure. Defining
the average values from three virgin PET (solid black circle: 270 °C, 2.0 bar; solid red triangle:
280 °C, 2.0 bar) as the reference points, quadrants can be constructed as shown
Y. Qin et al.
(a)
(b)
(c)
Fig. 21 Performace-reliability charts, plotting Weibull moduli m F , m T , m ε respectively versus the
characteristic force at break F 0 , characteristic tenacity T 0 , and characteristic elongation at break
ε b,0 for rPET-B fibres. The number embedded in the symbol shows the take-up pressure. Defining
the average values from three virgin PET (solid black circle: 270 °C, 2.0 bar; solid red triangle:
280 °C, 2.0 bar) as the reference points, quadrants can be constructed as shown