

32
Y. Qin et al.
(a)
(b)
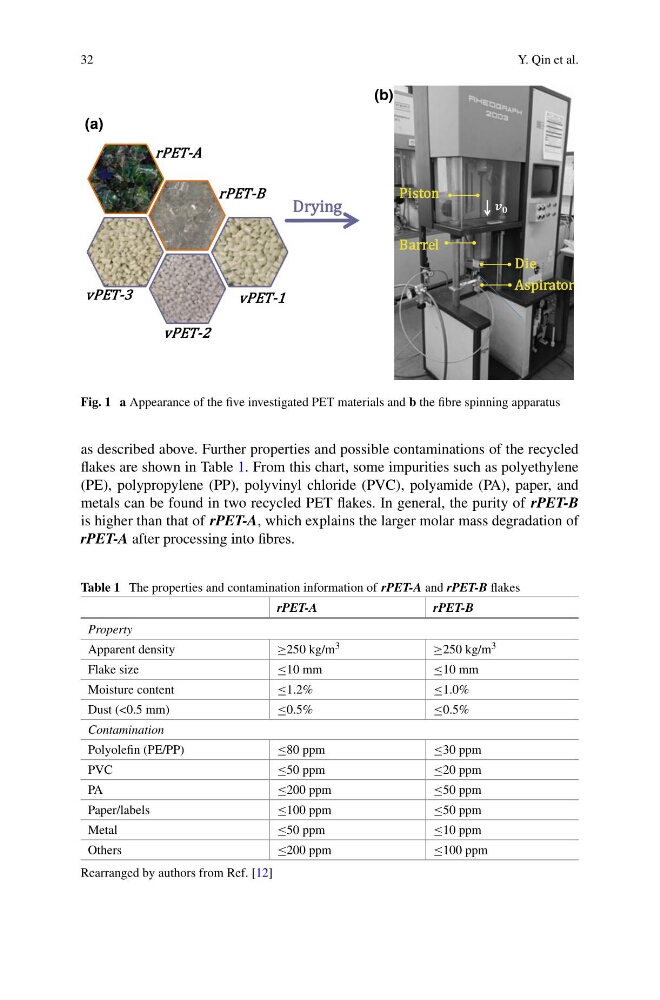
Fig. 1 a Appearance of the five investigated PET materials and b the fibre spinning apparatus
as described above. Further properties and possible contaminations of the recycled
flakes are shown in Table 1. From this chart, some impurities such as polyethylene
(PE), polypropylene (PP), polyvinyl chloride (PVC), polyamide (PA), paper, and
metals can be found in two recycled PET flakes. In general, the purity of rPET-B
is higher than that of rPET-A, which explains the larger molar mass degradation of
rPET-A after processing into fibres.
Table 1 The properties and contamination information of rPET-A and rPET-B flakes
rPET-A
rPET-B
Property
Apparent density
≥250 kg/m 3
≥250 kg/m 3
Flake size
≤10 mm
≤10 mm
Moisture content
≤1.2%
≤1.0%
Dust (<0.5 mm)
≤0.5%
≤0.5%
Contamination
Polyolefin (PE/PP)
≤80 ppm
≤30 ppm
PVC
≤50 ppm
≤20 ppm
PA
≤200 ppm
≤50 ppm
Paper/labels
≤100 ppm
≤50 ppm
Metal
≤50 ppm
≤10 ppm
Others
≤200 ppm
≤100 ppm
Rearranged by authors from Ref. [12]
Y. Qin et al.
(a)
(b)
Fig. 1 a Appearance of the five investigated PET materials and b the fibre spinning apparatus
as described above. Further properties and possible contaminations of the recycled
flakes are shown in Table 1. From this chart, some impurities such as polyethylene
(PE), polypropylene (PP), polyvinyl chloride (PVC), polyamide (PA), paper, and
metals can be found in two recycled PET flakes. In general, the purity of rPET-B
is higher than that of rPET-A, which explains the larger molar mass degradation of
rPET-A after processing into fibres.
Table 1 The properties and contamination information of rPET-A and rPET-B flakes
rPET-A
rPET-B
Property
Apparent density
≥250 kg/m 3
≥250 kg/m 3
Flake size
≤10 mm
≤10 mm
Moisture content
≤1.2%
≤1.0%
Dust (<0.5 mm)
≤0.5%
≤0.5%
Contamination
Polyolefin (PE/PP)
≤80 ppm
≤30 ppm
PVC
≤50 ppm
≤20 ppm
PA
≤200 ppm
≤50 ppm
Paper/labels
≤100 ppm
≤50 ppm
Metal
≤50 ppm
≤10 ppm
Others
≤200 ppm
≤100 ppm
Rearranged by authors from Ref. [12]