

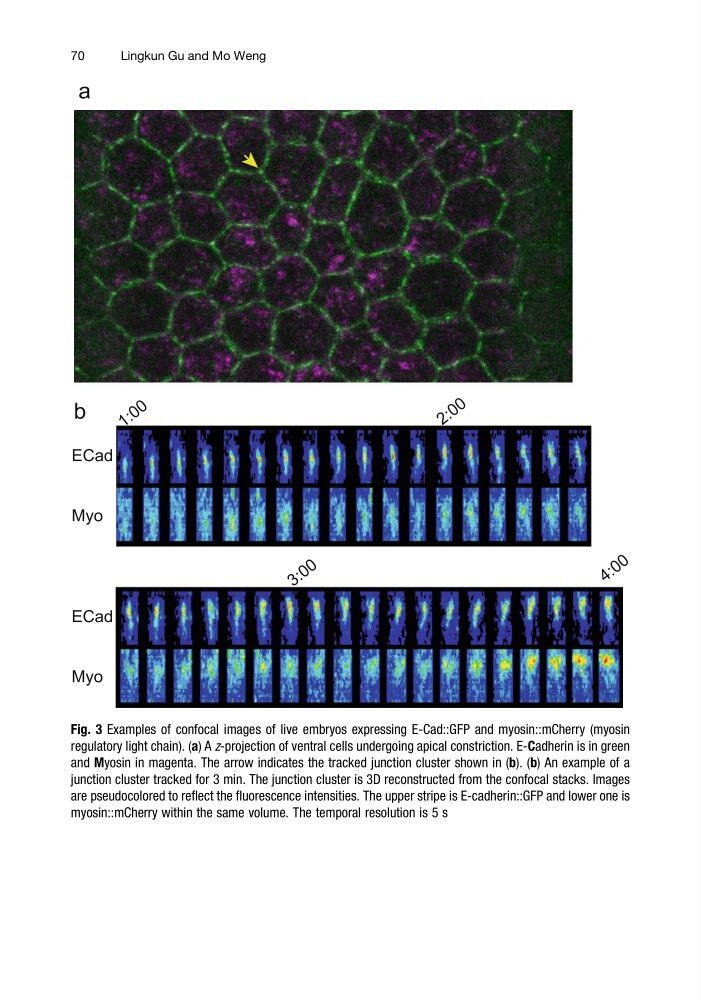
Fig. 3 Examples of confocal images of live embryos expressing E-Cad::GFP and myosin::mCherry (myosin
regulatory light chain). (a) A z-projection of ventral cells undergoing apical constriction. E-Cadherin is in green
and Myosin in magenta. The arrow indicates the tracked junction cluster shown in (b). (b) An example of a
junction cluster tracked for 3 min. The junction cluster is 3D reconstructed from the confocal stacks. Images
are pseudocolored to reflect the fluorescence intensities. The upper stripe is E-cadherin::GFP and lower one is
myosin::mCherry within the same volume. The temporal resolution is 5 s
70
Lingkun Gu and Mo Weng
regulatory light chain). (a) A z-projection of ventral cells undergoing apical constriction. E-Cadherin is in green
and Myosin in magenta. The arrow indicates the tracked junction cluster shown in (b). (b) An example of a
junction cluster tracked for 3 min. The junction cluster is 3D reconstructed from the confocal stacks. Images
are pseudocolored to reflect the fluorescence intensities. The upper stripe is E-cadherin::GFP and lower one is
myosin::mCherry within the same volume. The temporal resolution is 5 s
70
Lingkun Gu and Mo Weng