

in neighboring transfected cells, or compare the evolution of
fluorescence inside and outside the ROI in the targeted cell. In
order to quantify the cell response in terms of migration, use
the bright-field images and segment the cell contour to obtain
the deformation and migration of the cells over time. It is also
possible to run local morphometric analysis in order to quantify
the amount of ruffling activity.
Acknowledgements
The authors would like to warmly thank Mathieu Coppey for
fruitful discussions and critical reading of the manuscript. L.V. is
supported by a post-doctoral grant “Aide au Retour en France”
from the FRM (Fondation pour la Recherche Me ´dicale,
ARF20170938651) and by a Marie Skłodowska-Curie Fellowship.
References
1. Shoval I, Kalcheim C (2012) Antagonistic
activities of Rho and Rac GTPases underlie
the transition from neural crest delamination
to migration. Dev Dyn 241:1155–1168.
https://doi.org/10.1002/dvdy.23799
2. Scarpa E, Szabo ´ A, Bibonne A, Theveneau E,
Parsons M, Mayor R (2015) Cadherin switch
during EMT in neural crest cells leads to contact inhibition of locomotion via repolarization
of forces. Dev Cell 34:421–434. https://doi.
org/10.1016/j.devcel.2015.06.012
3. Nobes CD, Hall A (1995) Rho, rac, and cdc42
GTPases
regulate
the
assembly
of
multimolecular focal complexes associated
with actin stress fibers, lamellipodia, and filopodia. Cell 81:53–62
4. Nobes CD, Hall A (1999) Rho GTPases control polarity, protrusion, and adhesion during
cell movement. J Cell Biol 144:1235–1244
5. Burridge K, Wennerberg K (2004) Rho and
Rac take center stage. Cell 116:167–179.
https://doi.org/10.1016/S0092-8674(04)
00003-0
6. Machacek M, Hodgson L, Welch C, Elliott H,
Pertz O, Nalbant P, Abell A, Johnson GL,
Hahn KM, Danuser G (2009) Coordination
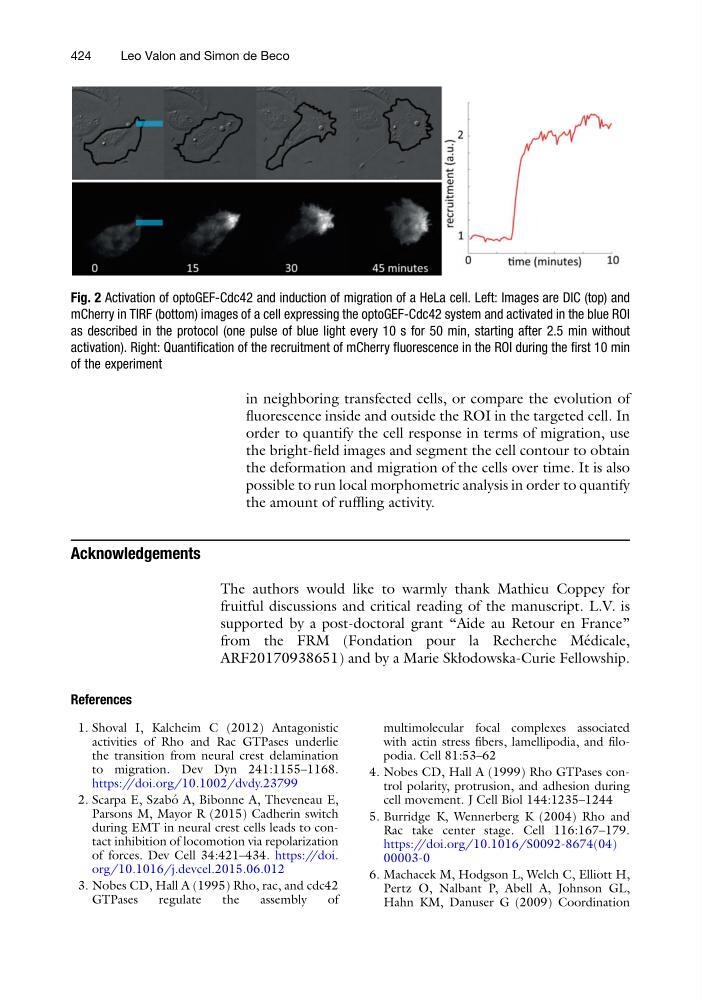
Fig. 2 Activation of optoGEF-Cdc42 and induction of migration of a HeLa cell. Left: Images are DIC (top) and
mCherry in TIRF (bottom) images of a cell expressing the optoGEF-Cdc42 system and activated in the blue ROI
as described in the protocol (one pulse of blue light every 10 s for 50 min, starting after 2.5 min without
activation). Right: Quantification of the recruitment of mCherry fluorescence in the ROI during the first 10 min
of the experiment
424
Leo Valon and Simon de Beco
fluorescence inside and outside the ROI in the targeted cell. In
order to quantify the cell response in terms of migration, use
the bright-field images and segment the cell contour to obtain
the deformation and migration of the cells over time. It is also
possible to run local morphometric analysis in order to quantify
the amount of ruffling activity.
Acknowledgements
The authors would like to warmly thank Mathieu Coppey for
fruitful discussions and critical reading of the manuscript. L.V. is
supported by a post-doctoral grant “Aide au Retour en France”
from the FRM (Fondation pour la Recherche Me ´dicale,
ARF20170938651) and by a Marie Skłodowska-Curie Fellowship.
References
1. Shoval I, Kalcheim C (2012) Antagonistic
activities of Rho and Rac GTPases underlie
the transition from neural crest delamination
to migration. Dev Dyn 241:1155–1168.
https://doi.org/10.1002/dvdy.23799
2. Scarpa E, Szabo ´ A, Bibonne A, Theveneau E,
Parsons M, Mayor R (2015) Cadherin switch
during EMT in neural crest cells leads to contact inhibition of locomotion via repolarization
of forces. Dev Cell 34:421–434. https://doi.
org/10.1016/j.devcel.2015.06.012
3. Nobes CD, Hall A (1995) Rho, rac, and cdc42
GTPases
regulate
the
assembly
of
multimolecular focal complexes associated
with actin stress fibers, lamellipodia, and filopodia. Cell 81:53–62
4. Nobes CD, Hall A (1999) Rho GTPases control polarity, protrusion, and adhesion during
cell movement. J Cell Biol 144:1235–1244
5. Burridge K, Wennerberg K (2004) Rho and
Rac take center stage. Cell 116:167–179.
https://doi.org/10.1016/S0092-8674(04)
00003-0
6. Machacek M, Hodgson L, Welch C, Elliott H,
Pertz O, Nalbant P, Abell A, Johnson GL,
Hahn KM, Danuser G (2009) Coordination
Fig. 2 Activation of optoGEF-Cdc42 and induction of migration of a HeLa cell. Left: Images are DIC (top) and
mCherry in TIRF (bottom) images of a cell expressing the optoGEF-Cdc42 system and activated in the blue ROI
as described in the protocol (one pulse of blue light every 10 s for 50 min, starting after 2.5 min without
activation). Right: Quantification of the recruitment of mCherry fluorescence in the ROI during the first 10 min
of the experiment
424
Leo Valon and Simon de Beco