

3.5 Flow Cytometry
1. At the end of each EMT or MET phases, recover cells to be
analysed by flow cytometry.
2. Stain freshly harvested cells with Live/Dead cell viability solution for 20 min in obscurity. For E-cadherin staining, block
cells in 5% FBS/1% BSA/PBS for 30 min and incubate with
PE-conjugated anti-E-cadherin (1:10 dilution in 5% FBS/1%
BSA/PBS).
3. Fix cells using a solution of 1% PFA/PBS for 30 min, permeabilize with 0.1% Triton-X100/PBS for 20 min and block with
5% FBS/1% BSA/PBS for 30 min.
4. Following PBS washes, incubate cells with APC-conjugated
anti-Fibronectin (1:10 dilution in 5% FBS/1% BSA/PBS) for
20 min at 4
C. All incubations and staining are done at 4
C.
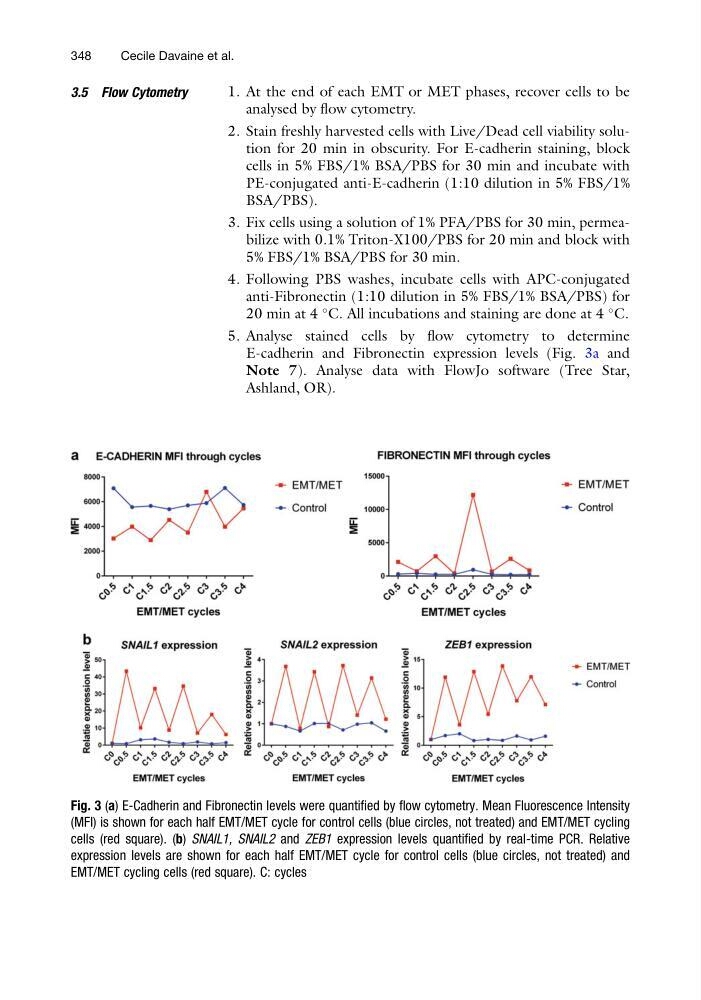
5. Analyse stained cells by flow cytometry to determine
E-cadherin and Fibronectin expression levels (Fig. 3a and
Note 7). Analyse data with FlowJo software (Tree Star,
Ashland, OR).
Fig. 3 (a) E-Cadherin and Fibronectin levels were quantified by flow cytometry. Mean Fluorescence Intensity
(MFI) is shown for each half EMT/MET cycle for control cells (blue circles, not treated) and EMT/MET cycling
cells (red square). (b) SNAIL1, SNAIL2 and ZEB1 expression levels quantified by real-time PCR. Relative
expression levels are shown for each half EMT/MET cycle for control cells (blue circles, not treated) and
EMT/MET cycling cells (red square). C: cycles
348
Cecile Davaine et al.
1. At the end of each EMT or MET phases, recover cells to be
analysed by flow cytometry.
2. Stain freshly harvested cells with Live/Dead cell viability solution for 20 min in obscurity. For E-cadherin staining, block
cells in 5% FBS/1% BSA/PBS for 30 min and incubate with
PE-conjugated anti-E-cadherin (1:10 dilution in 5% FBS/1%
BSA/PBS).
3. Fix cells using a solution of 1% PFA/PBS for 30 min, permeabilize with 0.1% Triton-X100/PBS for 20 min and block with
5% FBS/1% BSA/PBS for 30 min.
4. Following PBS washes, incubate cells with APC-conjugated
anti-Fibronectin (1:10 dilution in 5% FBS/1% BSA/PBS) for
20 min at 4
C. All incubations and staining are done at 4
C.
5. Analyse stained cells by flow cytometry to determine
E-cadherin and Fibronectin expression levels (Fig. 3a and
Note 7). Analyse data with FlowJo software (Tree Star,
Ashland, OR).
Fig. 3 (a) E-Cadherin and Fibronectin levels were quantified by flow cytometry. Mean Fluorescence Intensity
(MFI) is shown for each half EMT/MET cycle for control cells (blue circles, not treated) and EMT/MET cycling
cells (red square). (b) SNAIL1, SNAIL2 and ZEB1 expression levels quantified by real-time PCR. Relative
expression levels are shown for each half EMT/MET cycle for control cells (blue circles, not treated) and
EMT/MET cycling cells (red square). C: cycles
348
Cecile Davaine et al.