

meaningful signals in the visualization. This visualization results in a
set of x, y (and maybe z) coordinates that can be used to plot cells as
points in 2 or 3 dimensions. Cells can be colored according to time
of collection, batch, or expression of individual genes or gene
signatures. The second component of exploratory data analysis
involves searching for sets of cells with coherent gene expression
programs. There are two main ways to do this. The first is to cluster
cells (e.g., using Louvain clustering in diffusion component space).
The second is to define cell sets according to expression of gene
signatures. A gene signature is a list of genes (10 to 100 genes)
related to a specific biological process or cell state (e.g., Epithelial
Identity). To define an Epithelial cell state, we could select the top
10% of cells with highest expression of the Epithelial Identity gene
signature.
Trajectories
Clustering
tSNE, Seurat,
PCA, SC3,
UMAP
Waddington-OT,
URD, Monocle
edgeR, Monocle
SCDE, Seurat
Seurat
Biological Analysis
Cell Clustering,
Cell Trajectories/Pseudotime
Spatial Expression, Diff. Expression
Spatial
Differential
Cell QC and Normalization
SingleCellExperiment, scater,
scran, Seurat, SCONE
Read Quantification
featureCounts, UMI-tools count,
zUMIs, M3Drop, dropEst
Read Pseudo/Alignment
STAR, BWA, Bowtie2,
Kallisto, Salmon
Read Quality Control
FastQC, Kraken, Trimmomatic,
TrimGalore, Cutadapt
Demultiplex Samples + Cells
bcl2fastq2,
UMI-tools, zUMIs
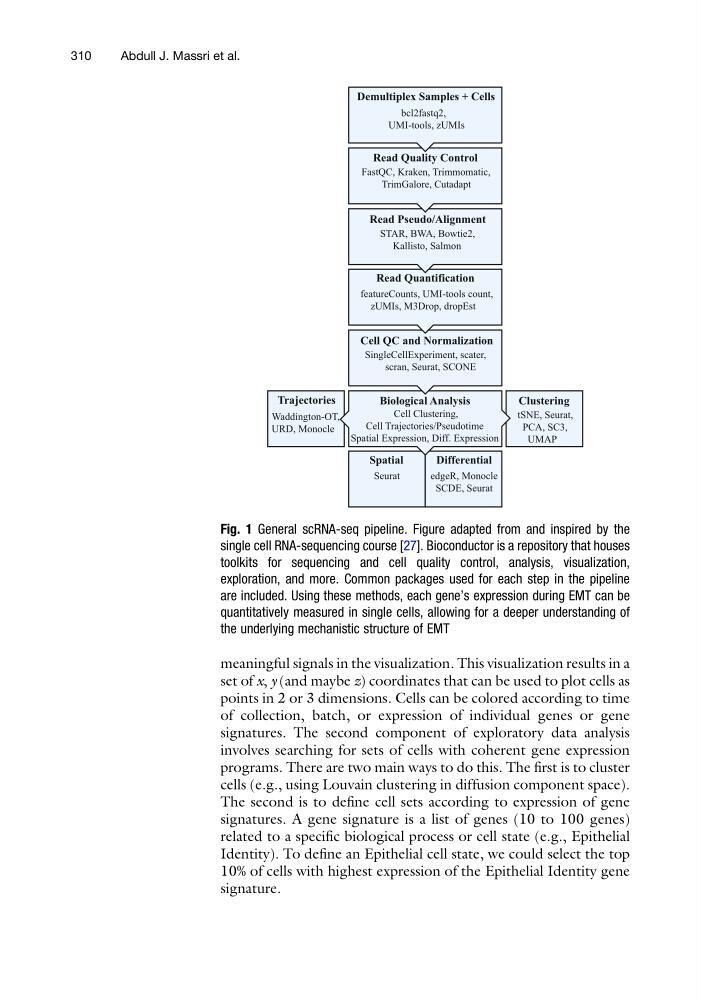
Fig. 1 General scRNA-seq pipeline. Figure adapted from and inspired by the
single cell RNA-sequencing course [27]. Bioconductor is a repository that houses
toolkits for sequencing and cell quality control, analysis, visualization,
exploration, and more. Common packages used for each step in the pipeline
are included. Using these methods, each gene’s expression during EMT can be
quantitatively measured in single cells, allowing for a deeper understanding of
the underlying mechanistic structure of EMT
310
Abdull J. Massri et al.
set of x, y (and maybe z) coordinates that can be used to plot cells as
points in 2 or 3 dimensions. Cells can be colored according to time
of collection, batch, or expression of individual genes or gene
signatures. The second component of exploratory data analysis
involves searching for sets of cells with coherent gene expression
programs. There are two main ways to do this. The first is to cluster
cells (e.g., using Louvain clustering in diffusion component space).
The second is to define cell sets according to expression of gene
signatures. A gene signature is a list of genes (10 to 100 genes)
related to a specific biological process or cell state (e.g., Epithelial
Identity). To define an Epithelial cell state, we could select the top
10% of cells with highest expression of the Epithelial Identity gene
signature.
Trajectories
Clustering
tSNE, Seurat,
PCA, SC3,
UMAP
Waddington-OT,
URD, Monocle
edgeR, Monocle
SCDE, Seurat
Seurat
Biological Analysis
Cell Clustering,
Cell Trajectories/Pseudotime
Spatial Expression, Diff. Expression
Spatial
Differential
Cell QC and Normalization
SingleCellExperiment, scater,
scran, Seurat, SCONE
Read Quantification
featureCounts, UMI-tools count,
zUMIs, M3Drop, dropEst
Read Pseudo/Alignment
STAR, BWA, Bowtie2,
Kallisto, Salmon
Read Quality Control
FastQC, Kraken, Trimmomatic,
TrimGalore, Cutadapt
Demultiplex Samples + Cells
bcl2fastq2,
UMI-tools, zUMIs
Fig. 1 General scRNA-seq pipeline. Figure adapted from and inspired by the
single cell RNA-sequencing course [27]. Bioconductor is a repository that houses
toolkits for sequencing and cell quality control, analysis, visualization,
exploration, and more. Common packages used for each step in the pipeline
are included. Using these methods, each gene’s expression during EMT can be
quantitatively measured in single cells, allowing for a deeper understanding of
the underlying mechanistic structure of EMT
310
Abdull J. Massri et al.