

120
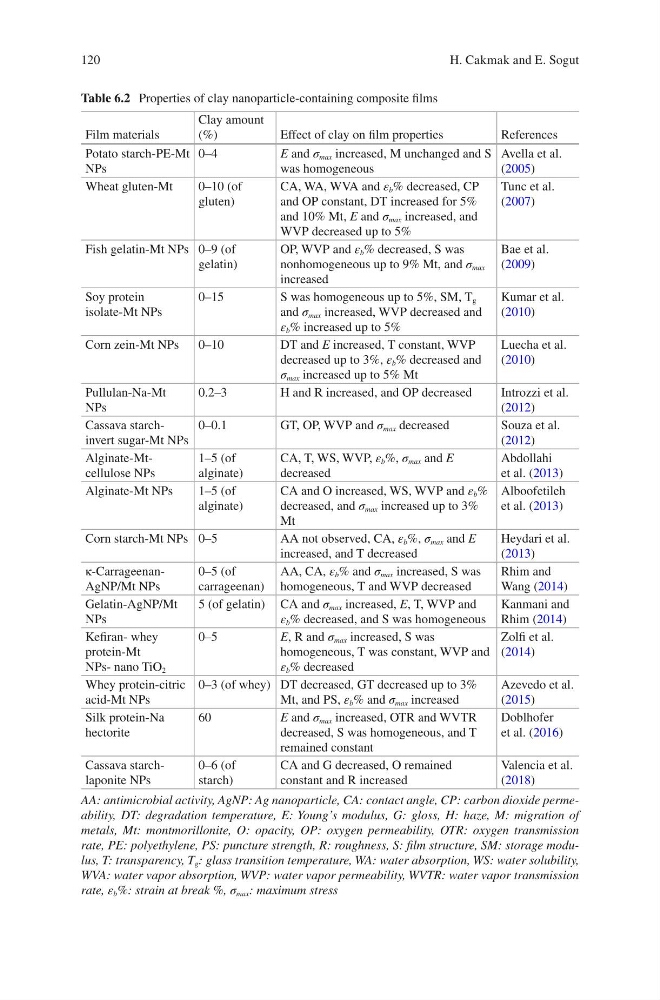
Table 6.2 Properties of clay nanoparticle-containing composite films
Film materials
Clay amount
(%)
Effect of clay on film properties
References
Potato starch-PE-Mt
NPs
0–4
E and σ max increased, M unchanged and S
was homogeneous
Avella et al.
(2005)
Wheat gluten-Mt
0–10 (of
gluten)
CA, WA, WVA and ε b % decreased, CP
and OP constant, DT increased for 5%
and 10% Mt, E and σ max increased, and
WVP decreased up to 5%
Tunc et al.
(2007)
Fish gelatin-Mt NPs 0–9 (of
gelatin)
OP, WVP and ε b % decreased, S was
nonhomogeneous up to 9% Mt, and σ max
increased
Bae et al.
(2009)
Soy protein
isolate-Mt NPs
0–15
S was homogeneous up to 5%, SM, T g
and σ max increased, WVP decreased and
ε b % increased up to 5%
Kumar et al.
(2010)
Corn zein-Mt NPs
0–10
DT and E increased, T constant, WVP
decreased up to 3%, ε b % decreased and
σ max increased up to 5% Mt
Luecha et al.
(2010)
Pullulan-Na-Mt
NPs
0.2–3
H and R increased, and OP decreased
Introzzi et al.
(2012)
Cassava starchinvert sugar-Mt NPs
0–0.1
GT, OP, WVP and σ max decreased
Souza et al.
(2012)
Alginate-Mtcellulose NPs
1–5 (of
alginate)
CA, T, WS, WVP, ε b %, σ max and E
decreased
Abdollahi
et al. (2013)
Alginate-Mt NPs
1–5 (of
alginate)
CA and O increased, WS, WVP and ε b %
decreased, and σ max increased up to 3%
Mt
Alboofetileh
et al. (2013)
Corn starch-Mt NPs 0–5
AA not observed, CA, ε b %, σ max and E
increased, and T decreased
Heydari et al.
(2013)
κ-CarrageenanAgNP/Mt NPs
0–5 (of
carrageenan)
AA, CA, ε b % and σ max increased, S was
homogeneous, T and WVP decreased
Rhim and
Wang (2014)
Gelatin-AgNP/Mt
NPs
5 (of gelatin) CA and σ max increased, E, T, WVP and
ε b % decreased, and S was homogeneous
Kanmani and
Rhim (2014)
Kefiran- whey
protein-Mt
NPs- nano TiO 2
0–5
E, R and σ max increased, S was
homogeneous, T was constant, WVP and
ε b % decreased
Zolfi et al.
(2014)
Whey protein-citric
acid-Mt NPs
0–3 (of whey) DT decreased, GT decreased up to 3%
Mt, and PS, ε b % and σ max increased
Azevedo et al.
(2015)
Silk protein-Na
hectorite
60
E and σ max increased, OTR and WVTR
decreased, S was homogeneous, and T
remained constant
Doblhofer
et al. (2016)
Cassava starchlaponite NPs
0–6 (of
starch)
CA and G decreased, O remained
constant and R increased
Valencia et al.
(2018)
AA: antimicrobial activity, AgNP: Ag nanoparticle, CA: contact angle, CP: carbon dioxide permeability, DT: degradation temperature, E: Young’s modulus, G: gloss, H: haze, M: migration of
metals, Mt: montmorillonite, O: opacity, OP: oxygen permeability, OTR: oxygen transmission
rate, PE: polyethylene, PS: puncture strength, R: roughness, S: film structure, SM: storage modulus, T: transparency, T g : glass transition temperature, WA: water absorption, WS: water solubility,
WVA: water vapor absorption, WVP: water vapor permeability, WVTR: water vapor transmission
rate, ε b %: strain at break %, σ max : maximum stress
H. Cakmak and E. Sogut
Table 6.2 Properties of clay nanoparticle-containing composite films
Film materials
Clay amount
(%)
Effect of clay on film properties
References
Potato starch-PE-Mt
NPs
0–4
E and σ max increased, M unchanged and S
was homogeneous
Avella et al.
(2005)
Wheat gluten-Mt
0–10 (of
gluten)
CA, WA, WVA and ε b % decreased, CP
and OP constant, DT increased for 5%
and 10% Mt, E and σ max increased, and
WVP decreased up to 5%
Tunc et al.
(2007)
Fish gelatin-Mt NPs 0–9 (of
gelatin)
OP, WVP and ε b % decreased, S was
nonhomogeneous up to 9% Mt, and σ max
increased
Bae et al.
(2009)
Soy protein
isolate-Mt NPs
0–15
S was homogeneous up to 5%, SM, T g
and σ max increased, WVP decreased and
ε b % increased up to 5%
Kumar et al.
(2010)
Corn zein-Mt NPs
0–10
DT and E increased, T constant, WVP
decreased up to 3%, ε b % decreased and
σ max increased up to 5% Mt
Luecha et al.
(2010)
Pullulan-Na-Mt
NPs
0.2–3
H and R increased, and OP decreased
Introzzi et al.
(2012)
Cassava starchinvert sugar-Mt NPs
0–0.1
GT, OP, WVP and σ max decreased
Souza et al.
(2012)
Alginate-Mtcellulose NPs
1–5 (of
alginate)
CA, T, WS, WVP, ε b %, σ max and E
decreased
Abdollahi
et al. (2013)
Alginate-Mt NPs
1–5 (of
alginate)
CA and O increased, WS, WVP and ε b %
decreased, and σ max increased up to 3%
Mt
Alboofetileh
et al. (2013)
Corn starch-Mt NPs 0–5
AA not observed, CA, ε b %, σ max and E
increased, and T decreased
Heydari et al.
(2013)
κ-CarrageenanAgNP/Mt NPs
0–5 (of
carrageenan)
AA, CA, ε b % and σ max increased, S was
homogeneous, T and WVP decreased
Rhim and
Wang (2014)
Gelatin-AgNP/Mt
NPs
5 (of gelatin) CA and σ max increased, E, T, WVP and
ε b % decreased, and S was homogeneous
Kanmani and
Rhim (2014)
Kefiran- whey
protein-Mt
NPs- nano TiO 2
0–5
E, R and σ max increased, S was
homogeneous, T was constant, WVP and
ε b % decreased
Zolfi et al.
(2014)
Whey protein-citric
acid-Mt NPs
0–3 (of whey) DT decreased, GT decreased up to 3%
Mt, and PS, ε b % and σ max increased
Azevedo et al.
(2015)
Silk protein-Na
hectorite
60
E and σ max increased, OTR and WVTR
decreased, S was homogeneous, and T
remained constant
Doblhofer
et al. (2016)
Cassava starchlaponite NPs
0–6 (of
starch)
CA and G decreased, O remained
constant and R increased
Valencia et al.
(2018)
AA: antimicrobial activity, AgNP: Ag nanoparticle, CA: contact angle, CP: carbon dioxide permeability, DT: degradation temperature, E: Young’s modulus, G: gloss, H: haze, M: migration of
metals, Mt: montmorillonite, O: opacity, OP: oxygen permeability, OTR: oxygen transmission
rate, PE: polyethylene, PS: puncture strength, R: roughness, S: film structure, SM: storage modulus, T: transparency, T g : glass transition temperature, WA: water absorption, WS: water solubility,
WVA: water vapor absorption, WVP: water vapor permeability, WVTR: water vapor transmission
rate, ε b %: strain at break %, σ max : maximum stress
H. Cakmak and E. Sogut