

9. Check pH of the sample applying a small drop of the solution
on pH paper (use 0.5 μL of the sample). pH should be around
8.0 (see Note 24).
10. Add trypsin to the sample (ratio 1:50, i.e., 2 μg of trypsin per
100 μg of protein).
11. Incubate 16 h at 37
C with gentle agitation (400 rpm).
3.5 TMT Labeling
1. Immediately before use, equilibrate the TMT label reagents to
room temperature. For the 0.8 mg vials, add 41 μL of anhydrous acetonitrile to each tube. For the 5 mg vials, add 256 μL
of solvent to each tube. Allow the reagent to dissolve for 5 min
with occasional vortexing. Briefly centrifuge the tube to gather
the solution (see Note 25).
2. Carefully add 41 μL of the TMT Label Reagent to each 100 μL
sample (100 μg protein digest).
3. Incubate the reaction for 1 h at room temperature.
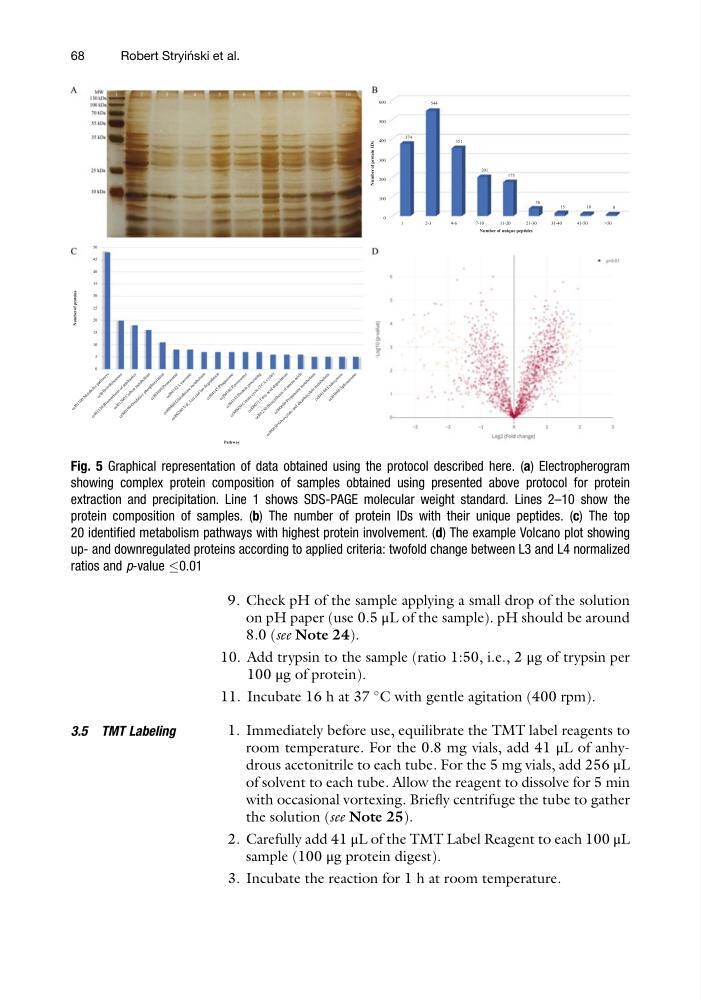
Fig. 5 Graphical representation of data obtained using the protocol described here. (a) Electropherogram
showing complex protein composition of samples obtained using presented above protocol for protein
extraction and precipitation. Line 1 shows SDS-PAGE molecular weight standard. Lines 2–10 show the
protein composition of samples. (b) The number of protein IDs with their unique peptides. (c) The top
20 identified metabolism pathways with highest protein involvement. (d) The example Volcano plot showing
up- and downregulated proteins according to applied criteria: twofold change between L3 and L4 normalized
ratios and p-value 0.01
68
Robert Stryin ´ ski et al.
on pH paper (use 0.5 μL of the sample). pH should be around
8.0 (see Note 24).
10. Add trypsin to the sample (ratio 1:50, i.e., 2 μg of trypsin per
100 μg of protein).
11. Incubate 16 h at 37
C with gentle agitation (400 rpm).
3.5 TMT Labeling
1. Immediately before use, equilibrate the TMT label reagents to
room temperature. For the 0.8 mg vials, add 41 μL of anhydrous acetonitrile to each tube. For the 5 mg vials, add 256 μL
of solvent to each tube. Allow the reagent to dissolve for 5 min
with occasional vortexing. Briefly centrifuge the tube to gather
the solution (see Note 25).
2. Carefully add 41 μL of the TMT Label Reagent to each 100 μL
sample (100 μg protein digest).
3. Incubate the reaction for 1 h at room temperature.
Fig. 5 Graphical representation of data obtained using the protocol described here. (a) Electropherogram
showing complex protein composition of samples obtained using presented above protocol for protein
extraction and precipitation. Line 1 shows SDS-PAGE molecular weight standard. Lines 2–10 show the
protein composition of samples. (b) The number of protein IDs with their unique peptides. (c) The top
20 identified metabolism pathways with highest protein involvement. (d) The example Volcano plot showing
up- and downregulated proteins according to applied criteria: twofold change between L3 and L4 normalized
ratios and p-value 0.01
68
Robert Stryin ´ ski et al.