

quantitative analysis, and then a box will pop up named
“MSstats Group Comparisons.” Name the comparison, select
the normalization method “Equalize medians,” ensure that the
“control group” is set to “control,” and under “Select group
(s) to compare against:,” select only “LPS.” Click “OK” to
start the computation. Results will be written in the same
directory as the skyline document, including the processed
data, statistical test results, volcano plot of changes, and comparison plots of all the proteins versus control. The volcano
plot produced by MSstats can be found in the same directory as
the skyline document with the name “VolcanoPlot.pdf” and
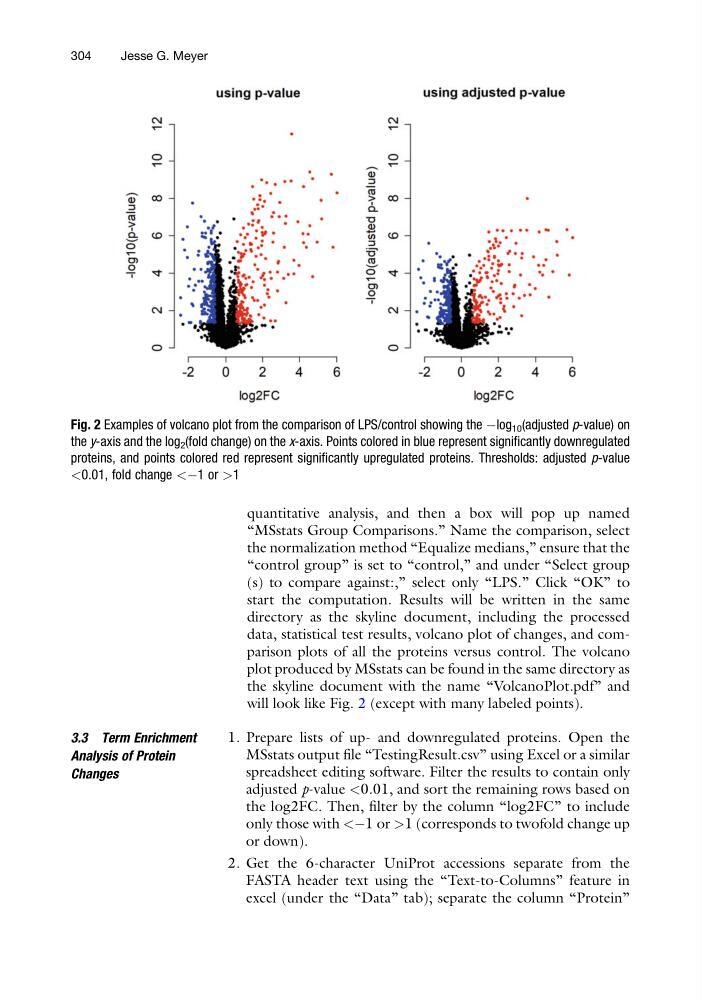
will look like Fig. 2 (except with many labeled points).
3.3 Term Enrichment
Analysis of Protein
Changes
1. Prepare lists of up- and downregulated proteins. Open the
MSstats output file “TestingResult.csv” using Excel or a similar
spreadsheet editing software. Filter the results to contain only
adjusted p-value <0.01, and sort the remaining rows based on
the log2FC. Then, filter by the column “log2FC” to include
only those with <À1 or >1 (corresponds to twofold change up
or down).
2. Get the 6-character UniProt accessions separate from the
FASTA header text using the “Text-to-Columns” feature in
excel (under the “Data” tab); separate the column “Protein”
Fig. 2 Examples of volcano plot from the comparison of LPS/control showing the Àlog 10 (adjusted p-value) on
the y-axis and the log 2 (fold change) on the x-axis. Points colored in blue represent significantly downregulated
proteins, and points colored red represent significantly upregulated proteins. Thresholds: adjusted p-value
<0.01, fold change <À1 or >1
304
Jesse G. Meyer
“MSstats Group Comparisons.” Name the comparison, select
the normalization method “Equalize medians,” ensure that the
“control group” is set to “control,” and under “Select group
(s) to compare against:,” select only “LPS.” Click “OK” to
start the computation. Results will be written in the same
directory as the skyline document, including the processed
data, statistical test results, volcano plot of changes, and comparison plots of all the proteins versus control. The volcano
plot produced by MSstats can be found in the same directory as
the skyline document with the name “VolcanoPlot.pdf” and
will look like Fig. 2 (except with many labeled points).
3.3 Term Enrichment
Analysis of Protein
Changes
1. Prepare lists of up- and downregulated proteins. Open the
MSstats output file “TestingResult.csv” using Excel or a similar
spreadsheet editing software. Filter the results to contain only
adjusted p-value <0.01, and sort the remaining rows based on
the log2FC. Then, filter by the column “log2FC” to include
only those with <À1 or >1 (corresponds to twofold change up
or down).
2. Get the 6-character UniProt accessions separate from the
FASTA header text using the “Text-to-Columns” feature in
excel (under the “Data” tab); separate the column “Protein”
Fig. 2 Examples of volcano plot from the comparison of LPS/control showing the Àlog 10 (adjusted p-value) on
the y-axis and the log 2 (fold change) on the x-axis. Points colored in blue represent significantly downregulated
proteins, and points colored red represent significantly upregulated proteins. Thresholds: adjusted p-value
<0.01, fold change <À1 or >1
304
Jesse G. Meyer