

of those peptides are assigned scores to observed spectra. The
peptide with the highest score is assigned to the spectra, and then
the probability that the PSM is true is usually assessed using the
target-decoy approach [2, 3]. The target-decoy strategy is based on
inclusion of shuffled peptide sequences (decoys) as possible
matches for spectra. When a decoy peptide sequence produces a
PSM, we assume that is a wrong answer. Because we include decoy
peptides, we can model the distribution of true and false PSMs, and
draw a score cutoff that contains a defined proportion of false
matches (or false discovery rate, FDR).
After peptides are identified, if our study is focused on proteins,
we must infer the presence of proteins in the sample from the
peptides we identified. Conceptually we can assume the presence
of any protein where we have identified a peptide sequence that
uniquely matches only that protein entry. To rigorously claim a
protein identity, we must transfer our peptide scores into protein
scores and apply statistics. There are many methods to achieve
protein inference [4], including ProteinProphet output as part of
this workflow [5], but in this work, we will use the simple and
generally stringent criteria of at least two unique peptides identified
per protein.
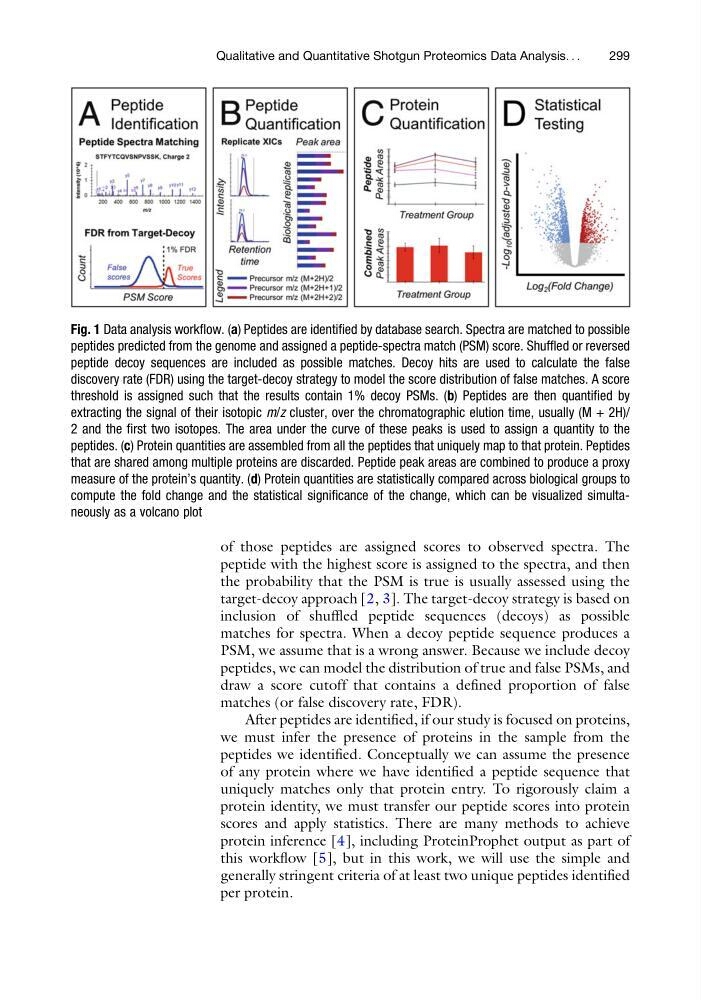
Fig. 1 Data analysis workflow. (a) Peptides are identified by database search. Spectra are matched to possible
peptides predicted from the genome and assigned a peptide-spectra match (PSM) score. Shuffled or reversed
peptide decoy sequences are included as possible matches. Decoy hits are used to calculate the false
discovery rate (FDR) using the target-decoy strategy to model the score distribution of false matches. A score
threshold is assigned such that the results contain 1% decoy PSMs. (b) Peptides are then quantified by
extracting the signal of their isotopic m/z cluster, over the chromatographic elution time, usually (M + 2H)/
2 and the first two isotopes. The area under the curve of these peaks is used to assign a quantity to the
peptides. (c) Protein quantities are assembled from all the peptides that uniquely map to that protein. Peptides
that are shared among multiple proteins are discarded. Peptide peak areas are combined to produce a proxy
measure of the protein’s quantity. (d) Protein quantities are statistically compared across biological groups to
compute the fold change and the statistical significance of the change, which can be visualized simultaneously as a volcano plot
Qualitative and Quantitative Shotgun Proteomics Data Analysis. . .
299
peptide with the highest score is assigned to the spectra, and then
the probability that the PSM is true is usually assessed using the
target-decoy approach [2, 3]. The target-decoy strategy is based on
inclusion of shuffled peptide sequences (decoys) as possible
matches for spectra. When a decoy peptide sequence produces a
PSM, we assume that is a wrong answer. Because we include decoy
peptides, we can model the distribution of true and false PSMs, and
draw a score cutoff that contains a defined proportion of false
matches (or false discovery rate, FDR).
After peptides are identified, if our study is focused on proteins,
we must infer the presence of proteins in the sample from the
peptides we identified. Conceptually we can assume the presence
of any protein where we have identified a peptide sequence that
uniquely matches only that protein entry. To rigorously claim a
protein identity, we must transfer our peptide scores into protein
scores and apply statistics. There are many methods to achieve
protein inference [4], including ProteinProphet output as part of
this workflow [5], but in this work, we will use the simple and
generally stringent criteria of at least two unique peptides identified
per protein.
Fig. 1 Data analysis workflow. (a) Peptides are identified by database search. Spectra are matched to possible
peptides predicted from the genome and assigned a peptide-spectra match (PSM) score. Shuffled or reversed
peptide decoy sequences are included as possible matches. Decoy hits are used to calculate the false
discovery rate (FDR) using the target-decoy strategy to model the score distribution of false matches. A score
threshold is assigned such that the results contain 1% decoy PSMs. (b) Peptides are then quantified by
extracting the signal of their isotopic m/z cluster, over the chromatographic elution time, usually (M + 2H)/
2 and the first two isotopes. The area under the curve of these peaks is used to assign a quantity to the
peptides. (c) Protein quantities are assembled from all the peptides that uniquely map to that protein. Peptides
that are shared among multiple proteins are discarded. Peptide peak areas are combined to produce a proxy
measure of the protein’s quantity. (d) Protein quantities are statistically compared across biological groups to
compute the fold change and the statistical significance of the change, which can be visualized simultaneously as a volcano plot
Qualitative and Quantitative Shotgun Proteomics Data Analysis. . .
299