

noticed. The repeatability of the analysis proved to be good, with
RSD of the spiked standards varying from 4.9% (PC standard) to
8.1% (TAG standard) (n ¼ 12).
3.1 Sample
Preparation: FreezeDried Algal Biomass
1. Add 5 μL of standard mixture 1 and 200 μL of HPLC-grade
chloroform/methanol (2:1, v/v) and 100 μL of 0.15 M (0.9%)
sodium chloride to 5 mg of freeze-dried algae sample and
homogenize with three grinding balls (Ø 3 mm) for 2 min
(20 Hz) with mixer mill homogenizer.
2. Allow to stand for 30 min.
3. Centrifuge the sample for 3 min at 7800 Â g.
4. Collect the lower phase and add 10–20 μL of internal standard
mixture 2.
3.2 Lipidomics
Profiling Platform
(UPLC-MS)
1. The UPLC gradient is as follows: set to start at 35% B, to reach
80% B in 2 min and 100% B in 7 min and remain there for
7 min. The total run time including a 4 min re-equilibration
step at initial conditions is 18 min. An example chromatogram
is shown in Fig. 2.
2. Set the temperature of the column to 50
C.
3. Set the temperature of the sample organizer to 10
C.
4. Set the flow rate to 0.400 mL/min.
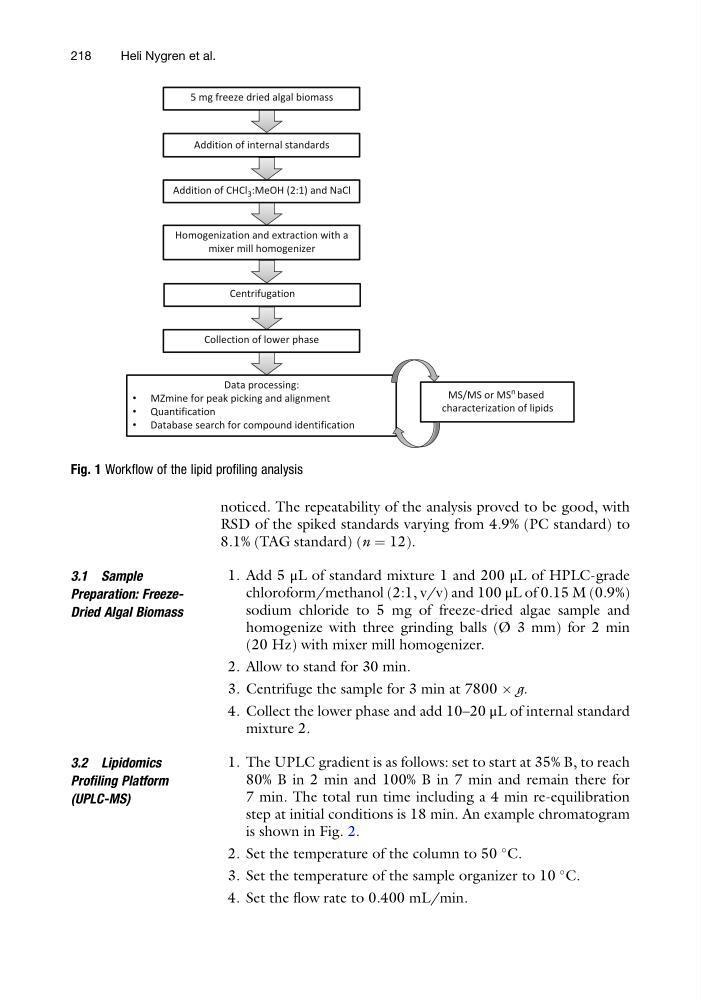
5 mg freeze dried algal biomass
Addition of internal standards
Homogenization and extraction with a
mixer mill homogenizer
Centrifugation
Collection of lower phase
•
• Quantification
•
Addition of CHCl 3 :MeOH (2:1) and NaCl
characterization of lipids
MS/MS or MS
n based
Data processing:
MZmine for peak picking and alignment
Database search for compound identification
Fig. 1 Workflow of the lipid profiling analysis
218
Heli Nygren et al.
RSD of the spiked standards varying from 4.9% (PC standard) to
8.1% (TAG standard) (n ¼ 12).
3.1 Sample
Preparation: FreezeDried Algal Biomass
1. Add 5 μL of standard mixture 1 and 200 μL of HPLC-grade
chloroform/methanol (2:1, v/v) and 100 μL of 0.15 M (0.9%)
sodium chloride to 5 mg of freeze-dried algae sample and
homogenize with three grinding balls (Ø 3 mm) for 2 min
(20 Hz) with mixer mill homogenizer.
2. Allow to stand for 30 min.
3. Centrifuge the sample for 3 min at 7800 Â g.
4. Collect the lower phase and add 10–20 μL of internal standard
mixture 2.
3.2 Lipidomics
Profiling Platform
(UPLC-MS)
1. The UPLC gradient is as follows: set to start at 35% B, to reach
80% B in 2 min and 100% B in 7 min and remain there for
7 min. The total run time including a 4 min re-equilibration
step at initial conditions is 18 min. An example chromatogram
is shown in Fig. 2.
2. Set the temperature of the column to 50
C.
3. Set the temperature of the sample organizer to 10
C.
4. Set the flow rate to 0.400 mL/min.
5 mg freeze dried algal biomass
Addition of internal standards
Homogenization and extraction with a
mixer mill homogenizer
Centrifugation
Collection of lower phase
•
• Quantification
•
Addition of CHCl 3 :MeOH (2:1) and NaCl
characterization of lipids
MS/MS or MS
n based
Data processing:
MZmine for peak picking and alignment
Database search for compound identification
Fig. 1 Workflow of the lipid profiling analysis
218
Heli Nygren et al.