

12.2.2.5 The Future
While it is difficult to forecast how the pathways of introduction and dispersal will
change in the future, some predictions can be made based on recent or forecasted
changes to the socio-economic importance of these pathways (see Appendix 2 in van
Wilgen and Wilson 2018 for the data and sources used in these assessments).
Intentional introductions for some purposes are likely to increase in the future. For
example, recently there has been an increase in biological control research and
implementation (Zachariades et al. 2017; Faulkner and Wilson 2018), there is
considerable interest in new agricultural opportunities [e.g. the introduction of
grasses for biofuels (Visser et al. 2017b)], and there is continuing demand from
consumers for new varieties of ornamental plants (Middleton 2015; Faulkner and
Wilson 2018). Therefore, in the future the release of biological control agents could
continue to increase, and there could also be an increase in the introduction of new
taxa for agriculture and horticulture (Faulkner and Wilson 2018). Socio-cultural
resistance, however, could influence introductions through some pathways. The
hunting industry, for instance, may benefit from a decline in the hunting opportunities available in other countries, but could be negatively affected by increasing
global anti-hunting sentiment and publicity (Fig. 12.1; also see Taylor et al. 2015).
It is, therefore, uncertain whether introductions for hunting will continue at an
increasing rate. Under the recently promulgated Alien and Invasive Species Regulations of the National Environmental Management: Biodiversity Act (NEM:BA,
Act No. 10 of 2004), a permit is required to intentionally import a new alien taxon
into South Africa. Such a permit is only approved by the Department of Environment, Forestry and Fisheries if a risk assessment, performed by a professional
scientist, shows the risk of invasion to be low. Therefore, while new alien taxa
will continue to be intentionally introduced through some pathways, these organisms
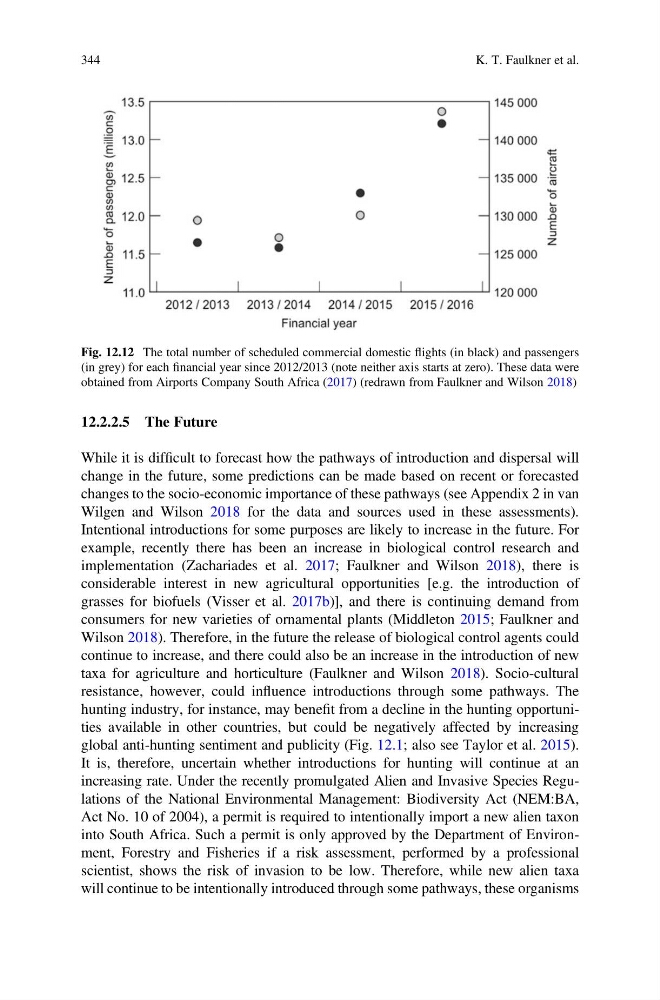
Fig. 12.12 The total number of scheduled commercial domestic flights (in black) and passengers
(in grey) for each financial year since 2012/2013 (note neither axis starts at zero). These data were
obtained from Airports Company South Africa (2017) (redrawn from Faulkner and Wilson 2018)
344
K. T. Faulkner et al.
While it is difficult to forecast how the pathways of introduction and dispersal will
change in the future, some predictions can be made based on recent or forecasted
changes to the socio-economic importance of these pathways (see Appendix 2 in van
Wilgen and Wilson 2018 for the data and sources used in these assessments).
Intentional introductions for some purposes are likely to increase in the future. For
example, recently there has been an increase in biological control research and
implementation (Zachariades et al. 2017; Faulkner and Wilson 2018), there is
considerable interest in new agricultural opportunities [e.g. the introduction of
grasses for biofuels (Visser et al. 2017b)], and there is continuing demand from
consumers for new varieties of ornamental plants (Middleton 2015; Faulkner and
Wilson 2018). Therefore, in the future the release of biological control agents could
continue to increase, and there could also be an increase in the introduction of new
taxa for agriculture and horticulture (Faulkner and Wilson 2018). Socio-cultural
resistance, however, could influence introductions through some pathways. The
hunting industry, for instance, may benefit from a decline in the hunting opportunities available in other countries, but could be negatively affected by increasing
global anti-hunting sentiment and publicity (Fig. 12.1; also see Taylor et al. 2015).
It is, therefore, uncertain whether introductions for hunting will continue at an
increasing rate. Under the recently promulgated Alien and Invasive Species Regulations of the National Environmental Management: Biodiversity Act (NEM:BA,
Act No. 10 of 2004), a permit is required to intentionally import a new alien taxon
into South Africa. Such a permit is only approved by the Department of Environment, Forestry and Fisheries if a risk assessment, performed by a professional
scientist, shows the risk of invasion to be low. Therefore, while new alien taxa
will continue to be intentionally introduced through some pathways, these organisms
Fig. 12.12 The total number of scheduled commercial domestic flights (in black) and passengers
(in grey) for each financial year since 2012/2013 (note neither axis starts at zero). These data were
obtained from Airports Company South Africa (2017) (redrawn from Faulkner and Wilson 2018)
344
K. T. Faulkner et al.