

variation of elevation), environmental favourableness (mean annual precipitation,
mean soil water stress, mean growing temperature, mean temperature of the coldest
month), energy (mean annual temperature, mean productivity), irregularity (coefficient of variability of rainfall), and human footprint (index of human influence) in
structuring diversity patterns (methods are described in Supplementary Appendix
3.4). To do this, we used SAPIA data for alien species and the Botanical Database
of Southern Africa data for native plant species at the scale of QDGCs. Previous
work showed that species richness of native plants in South Africa could be
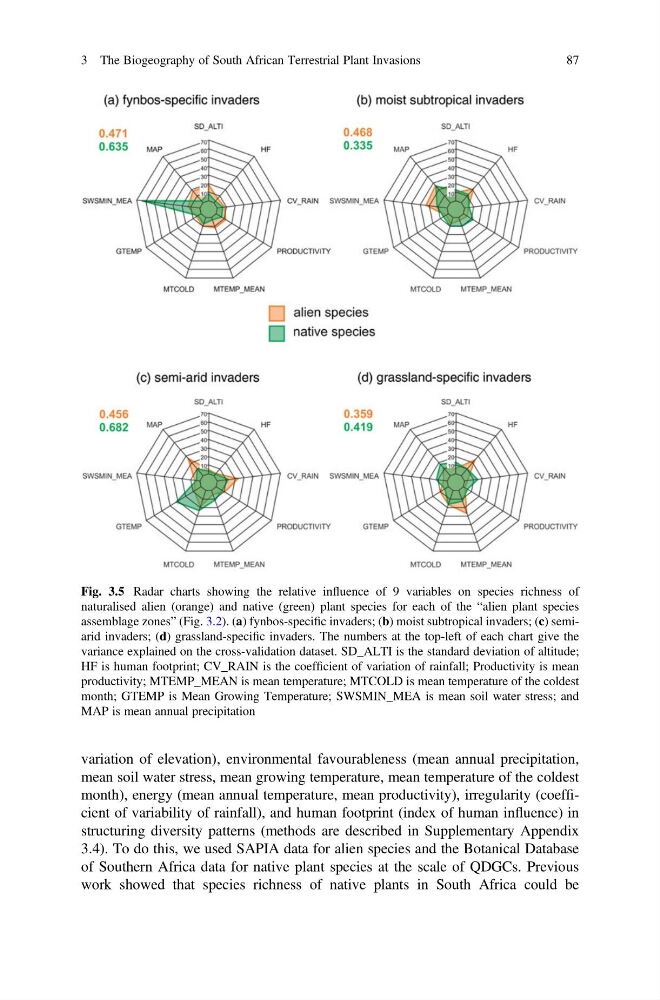
Fig. 3.5 Radar charts showing the relative influence of 9 variables on species richness of
naturalised alien (orange) and native (green) plant species for each of the “alien plant species
assemblage zones” (Fig. 3.2). (a) fynbos-specific invaders; (b) moist subtropical invaders; (c) semiarid invaders; (d) grassland-specific invaders. The numbers at the top-left of each chart give the
variance explained on the cross-validation dataset. SD_ALTI is the standard deviation of altitude;
HF is human footprint; CV_RAIN is the coefficient of variation of rainfall; Productivity is mean
productivity; MTEMP_MEAN is mean temperature; MTCOLD is mean temperature of the coldest
month; GTEMP is Mean Growing Temperature; SWSMIN_MEA is mean soil water stress; and
MAP is mean annual precipitation
3 The Biogeography of South African Terrestrial Plant Invasions
87
mean soil water stress, mean growing temperature, mean temperature of the coldest
month), energy (mean annual temperature, mean productivity), irregularity (coefficient of variability of rainfall), and human footprint (index of human influence) in
structuring diversity patterns (methods are described in Supplementary Appendix
3.4). To do this, we used SAPIA data for alien species and the Botanical Database
of Southern Africa data for native plant species at the scale of QDGCs. Previous
work showed that species richness of native plants in South Africa could be
Fig. 3.5 Radar charts showing the relative influence of 9 variables on species richness of
naturalised alien (orange) and native (green) plant species for each of the “alien plant species
assemblage zones” (Fig. 3.2). (a) fynbos-specific invaders; (b) moist subtropical invaders; (c) semiarid invaders; (d) grassland-specific invaders. The numbers at the top-left of each chart give the
variance explained on the cross-validation dataset. SD_ALTI is the standard deviation of altitude;
HF is human footprint; CV_RAIN is the coefficient of variation of rainfall; Productivity is mean
productivity; MTEMP_MEAN is mean temperature; MTCOLD is mean temperature of the coldest
month; GTEMP is Mean Growing Temperature; SWSMIN_MEA is mean soil water stress; and
MAP is mean annual precipitation
3 The Biogeography of South African Terrestrial Plant Invasions
87