

of their ranges in multiple zones; in many cases such species occur in azonal habitats
such a riparian zones; we term this cluster “pervasive/riparian invaders” (Table 3.1).
3.5.2 Correlates of Alien and Native Species Richness
We explored the correlates of species richness for alien and native species to assess
the relative roles of factors associated with topographic heterogeneity (coefficient of
20°E
25°E
30°E
25°S
30°S
35°S
Moist
subtropical
invaders
Grasslandspecific
invaders
Fynbosspecific
invaders
Semi-arid
invaders
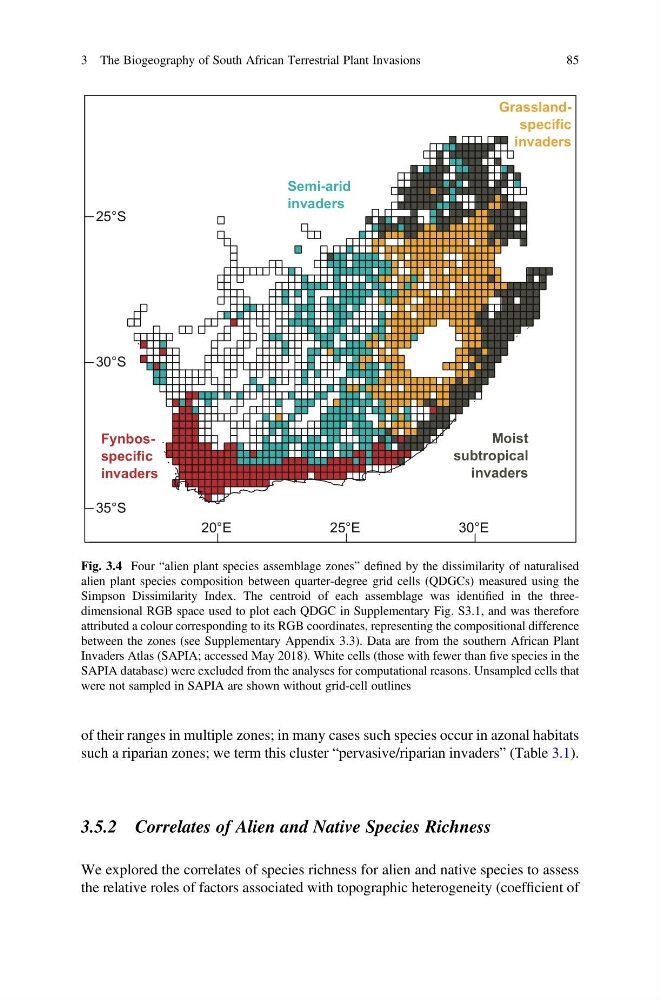
Fig. 3.4 Four “alien plant species assemblage zones” defined by the dissimilarity of naturalised
alien plant species composition between quarter-degree grid cells (QDGCs) measured using the
Simpson Dissimilarity Index. The centroid of each assemblage was identified in the threedimensional RGB space used to plot each QDGC in Supplementary Fig. S3.1, and was therefore
attributed a colour corresponding to its RGB coordinates, representing the compositional difference
between the zones (see Supplementary Appendix 3.3). Data are from the southern African Plant
Invaders Atlas (SAPIA; accessed May 2018). White cells (those with fewer than five species in the
SAPIA database) were excluded from the analyses for computational reasons. Unsampled cells that
were not sampled in SAPIA are shown without grid-cell outlines
3 The Biogeography of South African Terrestrial Plant Invasions
85
such a riparian zones; we term this cluster “pervasive/riparian invaders” (Table 3.1).
3.5.2 Correlates of Alien and Native Species Richness
We explored the correlates of species richness for alien and native species to assess
the relative roles of factors associated with topographic heterogeneity (coefficient of
20°E
25°E
30°E
25°S
30°S
35°S
Moist
subtropical
invaders
Grasslandspecific
invaders
Fynbosspecific
invaders
Semi-arid
invaders
Fig. 3.4 Four “alien plant species assemblage zones” defined by the dissimilarity of naturalised
alien plant species composition between quarter-degree grid cells (QDGCs) measured using the
Simpson Dissimilarity Index. The centroid of each assemblage was identified in the threedimensional RGB space used to plot each QDGC in Supplementary Fig. S3.1, and was therefore
attributed a colour corresponding to its RGB coordinates, representing the compositional difference
between the zones (see Supplementary Appendix 3.3). Data are from the southern African Plant
Invaders Atlas (SAPIA; accessed May 2018). White cells (those with fewer than five species in the
SAPIA database) were excluded from the analyses for computational reasons. Unsampled cells that
were not sampled in SAPIA are shown without grid-cell outlines
3 The Biogeography of South African Terrestrial Plant Invasions
85