

1900 1920 1940 1960 1980 2000 2020
0
20
40
60
80
100
Year
Number of
protected
areas
proclaimed
agriculture
biocontrol
fur trade
hunting
pet trade
self introductions
nature conservation agencies
anglers
aquaculture and aquarium
interbasin transfers
attachment
dry ballast
ballast water
mariculture
ornamental
silviculture
agriculture
pet trade
accidental
1700 1800 1900 2000 2100
birds and
mammals
freshwater fish
marine
plants
reptiles
microbes
Group
Pathway Change in importance
Other
Xitsonga
Tshivenda
SiSwati
Sign language
Setswana
Sesotho
Sepedi
IsiZulu
IsiXhosa
IsiNdebele
English
Afrikaans
0
5
10
15
20
% of first language speakers
(a)
(b)
(c)
(d)
(e)
(f)
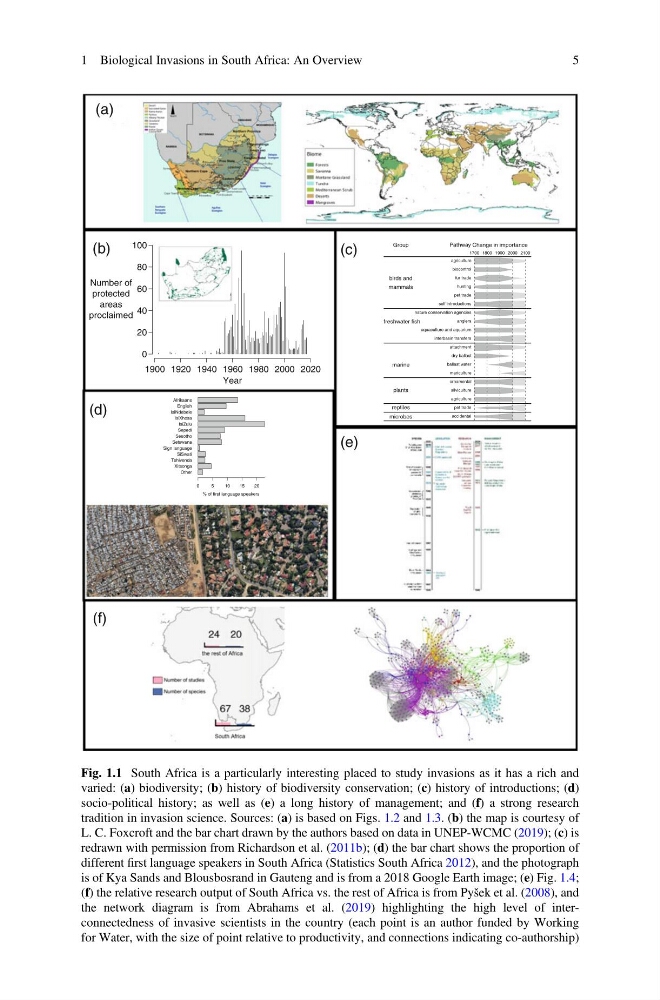
Fig. 1.1 South Africa is a particularly interesting placed to study invasions as it has a rich and
varied: (a) biodiversity; (b) history of biodiversity conservation; (c) history of introductions; (d)
socio-political history; as well as (e) a long history of management; and (f) a strong research
tradition in invasion science. Sources: (a) is based on Figs. 1.2 and 1.3. (b) the map is courtesy of
L. C. Foxcroft and the bar chart drawn by the authors based on data in UNEP-WCMC (2019); (c) is
redrawn with permission from Richardson et al. (2011b); (d) the bar chart shows the proportion of
different first language speakers in South Africa (Statistics South Africa 2012), and the photograph
is of Kya Sands and Blousbosrand in Gauteng and is from a 2018 Google Earth image; (e) Fig. 1.4;
(f) the relative research output of South Africa vs. the rest of Africa is from Pyšek et al. (2008), and
the network diagram is from Abrahams et al. (2019) highlighting the high level of interconnectedness of invasive scientists in the country (each point is an author funded by Working
for Water, with the size of point relative to productivity, and connections indicating co-authorship)
1 Biological Invasions in South Africa: An Overview
5
0
20
40
60
80
100
Year
Number of
protected
areas
proclaimed
agriculture
biocontrol
fur trade
hunting
pet trade
self introductions
nature conservation agencies
anglers
aquaculture and aquarium
interbasin transfers
attachment
dry ballast
ballast water
mariculture
ornamental
silviculture
agriculture
pet trade
accidental
1700 1800 1900 2000 2100
birds and
mammals
freshwater fish
marine
plants
reptiles
microbes
Group
Pathway Change in importance
Other
Xitsonga
Tshivenda
SiSwati
Sign language
Setswana
Sesotho
Sepedi
IsiZulu
IsiXhosa
IsiNdebele
English
Afrikaans
0
5
10
15
20
% of first language speakers
(a)
(b)
(c)
(d)
(e)
(f)
Fig. 1.1 South Africa is a particularly interesting placed to study invasions as it has a rich and
varied: (a) biodiversity; (b) history of biodiversity conservation; (c) history of introductions; (d)
socio-political history; as well as (e) a long history of management; and (f) a strong research
tradition in invasion science. Sources: (a) is based on Figs. 1.2 and 1.3. (b) the map is courtesy of
L. C. Foxcroft and the bar chart drawn by the authors based on data in UNEP-WCMC (2019); (c) is
redrawn with permission from Richardson et al. (2011b); (d) the bar chart shows the proportion of
different first language speakers in South Africa (Statistics South Africa 2012), and the photograph
is of Kya Sands and Blousbosrand in Gauteng and is from a 2018 Google Earth image; (e) Fig. 1.4;
(f) the relative research output of South Africa vs. the rest of Africa is from Pyšek et al. (2008), and
the network diagram is from Abrahams et al. (2019) highlighting the high level of interconnectedness of invasive scientists in the country (each point is an author funded by Working
for Water, with the size of point relative to productivity, and connections indicating co-authorship)
1 Biological Invasions in South Africa: An Overview
5