

identified. Cytosine formylation amounts at these sites can be estimated by
subtracting the percent cytosine methylation determined in the bisulfite only treated
sample (which is the sum of 5mC and 5hmC) from the percent of cytosine methylation in the fCAB-Seq sample data (which is the sum of 5mC, 5hmC, and 5fC)
[90]. Because 5fC is a minor component of DNA, each region of DNA was
⁄
ä
Fig. 8 (continued) of 5mC, 5hmC, 5fC, and 5caC. (b) Sample preparation scheme for differentiating 5mC and 5hmC in TAB-Seq [116] and oxBS-Seq [115]. (c) 5fC is deaminated and
deformylated by treatment with bisulfite. Protection of 5fC by reaction with O-ethylhydroxylamine
in fCAB-Seq prevents the deamination and deformylation that typically occur when 5fC is treated
with bisulfite [90]. In redBS-Seq, 5fC is reduced with sodium cyanoborohydride to 5hmC which
will resist deamination [119]. 5fC in the original sample can be determined by comparison of fCABSeq or redBS-Seq data with DNA that had undergone standard bisulfite sequencing. (d) Because
5fC and 5caC deaminate when treated with bisulfite, MAB-Seq utilizes the methylase M. SssI to
methylate unmodified cytosines. Following bisulfite treatment, 5mC and 5hmC will be identified
as C, while 5fC and 5caC are deaminated and identified as T [120]. caMAB-Seq first reduces 5fC to
5hmC and then follows MAB-Seq in order to specifically map 5caC [120]
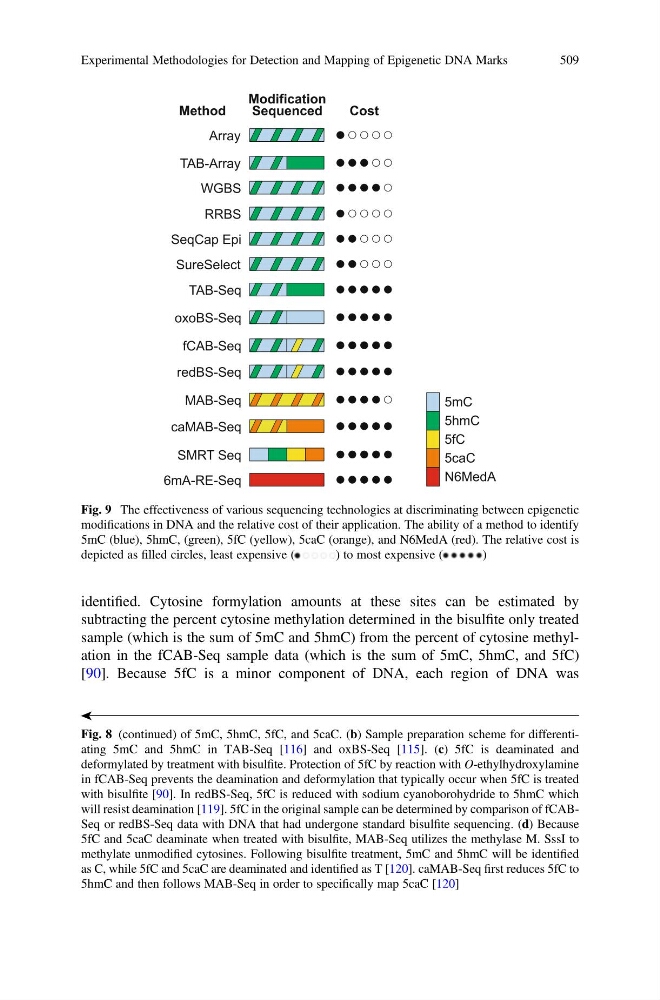
Fig. 9 The effectiveness of various sequencing technologies at discriminating between epigenetic
modifications in DNA and the relative cost of their application. The ability of a method to identify
5mC (blue), 5hmC, (green), 5fC (yellow), 5caC (orange), and N6MedA (red). The relative cost is
depicted as filled circles, least expensive (
) to most expensive (
)
Experimental Methodologies for Detection and Mapping of Epigenetic DNA Marks
509
subtracting the percent cytosine methylation determined in the bisulfite only treated
sample (which is the sum of 5mC and 5hmC) from the percent of cytosine methylation in the fCAB-Seq sample data (which is the sum of 5mC, 5hmC, and 5fC)
[90]. Because 5fC is a minor component of DNA, each region of DNA was
⁄
ä
Fig. 8 (continued) of 5mC, 5hmC, 5fC, and 5caC. (b) Sample preparation scheme for differentiating 5mC and 5hmC in TAB-Seq [116] and oxBS-Seq [115]. (c) 5fC is deaminated and
deformylated by treatment with bisulfite. Protection of 5fC by reaction with O-ethylhydroxylamine
in fCAB-Seq prevents the deamination and deformylation that typically occur when 5fC is treated
with bisulfite [90]. In redBS-Seq, 5fC is reduced with sodium cyanoborohydride to 5hmC which
will resist deamination [119]. 5fC in the original sample can be determined by comparison of fCABSeq or redBS-Seq data with DNA that had undergone standard bisulfite sequencing. (d) Because
5fC and 5caC deaminate when treated with bisulfite, MAB-Seq utilizes the methylase M. SssI to
methylate unmodified cytosines. Following bisulfite treatment, 5mC and 5hmC will be identified
as C, while 5fC and 5caC are deaminated and identified as T [120]. caMAB-Seq first reduces 5fC to
5hmC and then follows MAB-Seq in order to specifically map 5caC [120]
Fig. 9 The effectiveness of various sequencing technologies at discriminating between epigenetic
modifications in DNA and the relative cost of their application. The ability of a method to identify
5mC (blue), 5hmC, (green), 5fC (yellow), 5caC (orange), and N6MedA (red). The relative cost is
depicted as filled circles, least expensive (
) to most expensive (
)
Experimental Methodologies for Detection and Mapping of Epigenetic DNA Marks
509